
Figure 8. Cell clumps photographed at 10× magnification.
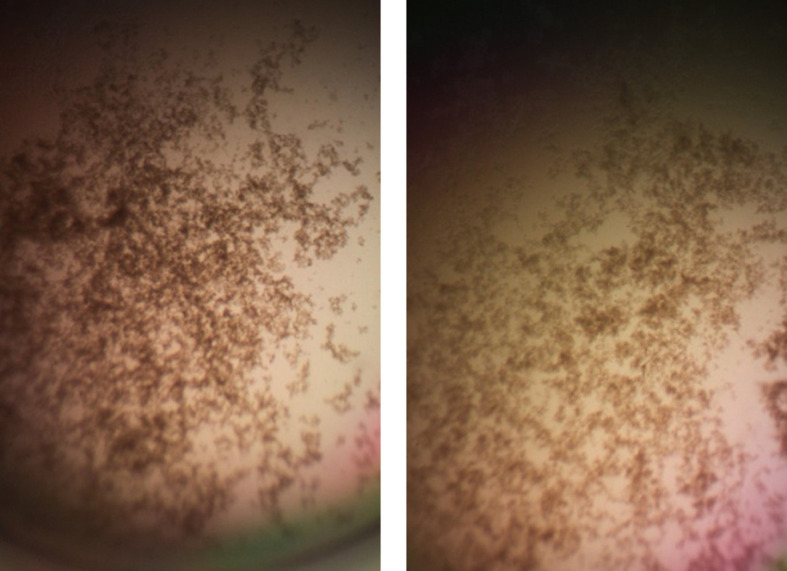
Left panel: 128 μg/mL HNP1 at the high inoculum. Right panel: 128 μg/mL HNP1 + 1:5 RNase at the high inoculum.
Official websites use .gov
A
.gov website belongs to an official
government organization in the United States.
Secure .gov websites use HTTPS
A lock (
) or https:// means you've safely
connected to the .gov website. Share sensitive
information only on official, secure websites.
Left panel: 128 μg/mL HNP1 at the high inoculum. Right panel: 128 μg/mL HNP1 + 1:5 RNase at the high inoculum.