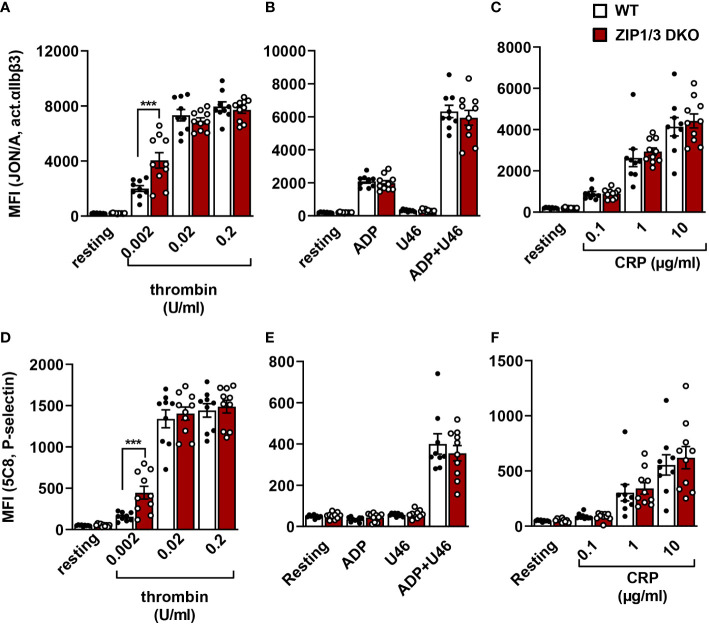
Figure 4.
Analysis of platelet integrin activation and degranulation by flow cytometry. Platelets from WT and ZIP1/3 DKO mice were activated with either thrombin (A, D), ADP (10µM), U46619 (3µM) and their combination (B, E) or CRP (C, F) and stained with saturating amounts of PE-coupled JON/A detecting activated αIIbβ3 integrin (A–C) or FITC-coupled anti-P-selectin (D–F). Mean background fluorescence of unstained platelets was subtracted from all data sets. n=9-10 (two-way ANOVA + Bonferroni), ***P<0.001.

