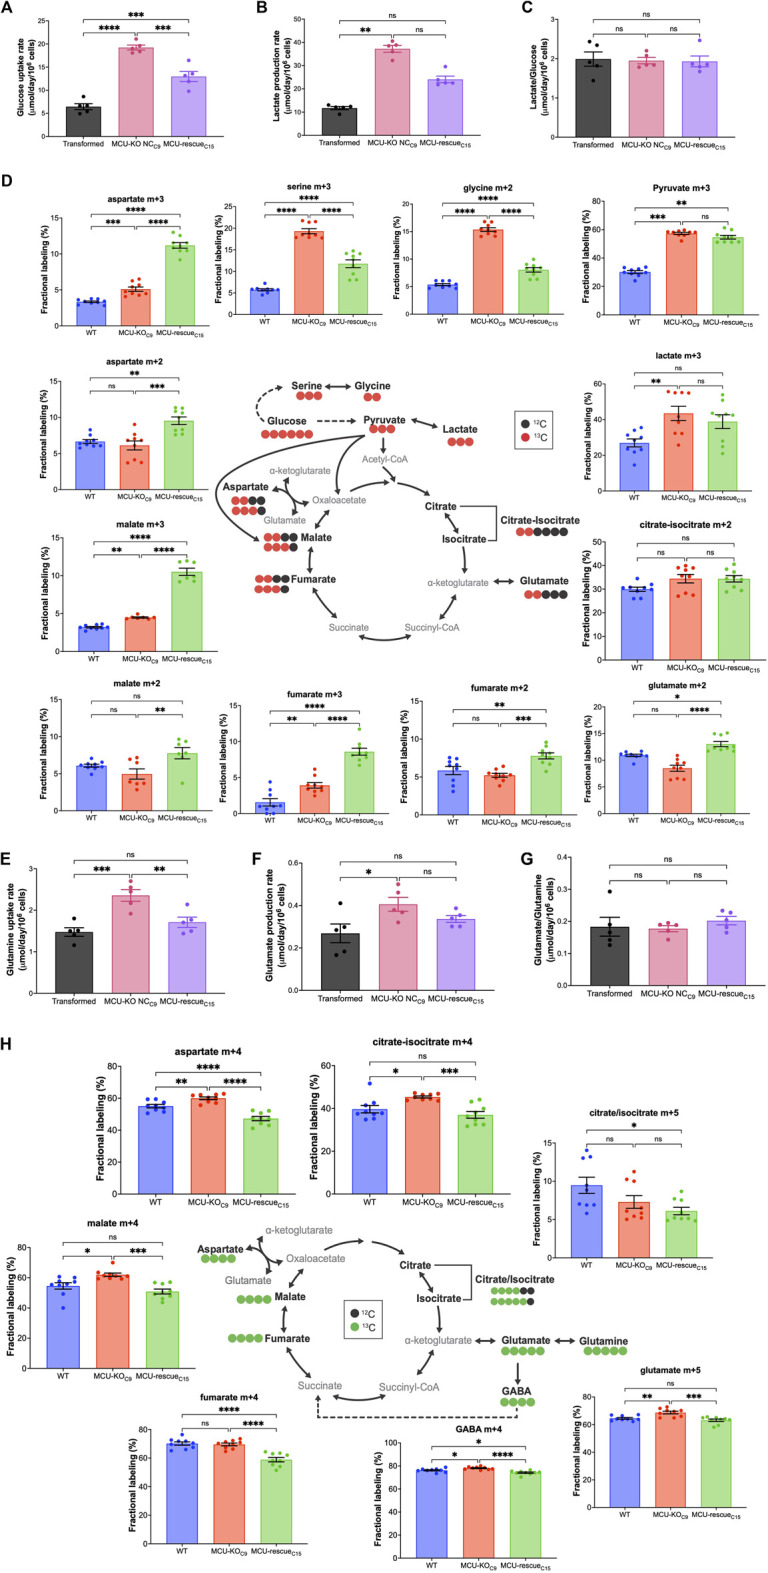
FIGURE 6.

Deletion of MCU alters glucose and glutamine metabolism. (A) Glucose-uptake rates of transformed fibroblasts (mean ± SEM, n = 5, ***p < 0.001, ****p < 0.0001, one-way ANOVA). (B) Lactate-production rates of transformed fibroblasts (mean ± SEM, n = 5, **p < 0.01, ns = non-significant, one-way ANOVA). (C) Lactate-production rates normalized to glucose-uptake rates (mean ± SEM, n = 5, ns = non-significant, one-way ANOVA). (D) Schematic representation of metabolic routes, labeling pattern of 13C6 d-Glucose-derived metabolites, and fractional labeling of isotopologues of interest (mean ± SEM, n = 8, ns = non-significant, *p < 0.05, **p < 0.01, ***p < 0.001, ****p < 0.0001, one-way ANOVA). Red circles represent labeling with 13C and black circles represent naturally-occurring 12C. Isotopologues of interest are represented by mass (m) and total number of 13C. (E) Glutamine-uptake rates of transformed fibroblasts (mean ± SEM, n = 5, ns = non-significant, **p < 0.01, ***p < 0.001, one-way ANOVA). (F) Glutamate-production rates of transformed fibroblasts (mean ± SEM, n = 5, ns = non-significant, *p < 0.05, one-way ANOVA). (G) Glutamate-production rates normalized to glutamine-uptake rates (mean ± SEM, n = 5, ns = non-significant, one-way ANOVA). (H) Schematic representation of metabolic routes, labeling pattern of 13C5 l-Glutamine-derived metabolites, and fractional labeling of isotopologues of interest (mean ± SEM, n = 8, ns = non-significant, *p < 0.05, **p < 0.01, ***p < 0.001, ****p < 0.0001, one-way ANOVA). Green circles represent labeling with 13C and black circles represent naturally occurring 12C.
