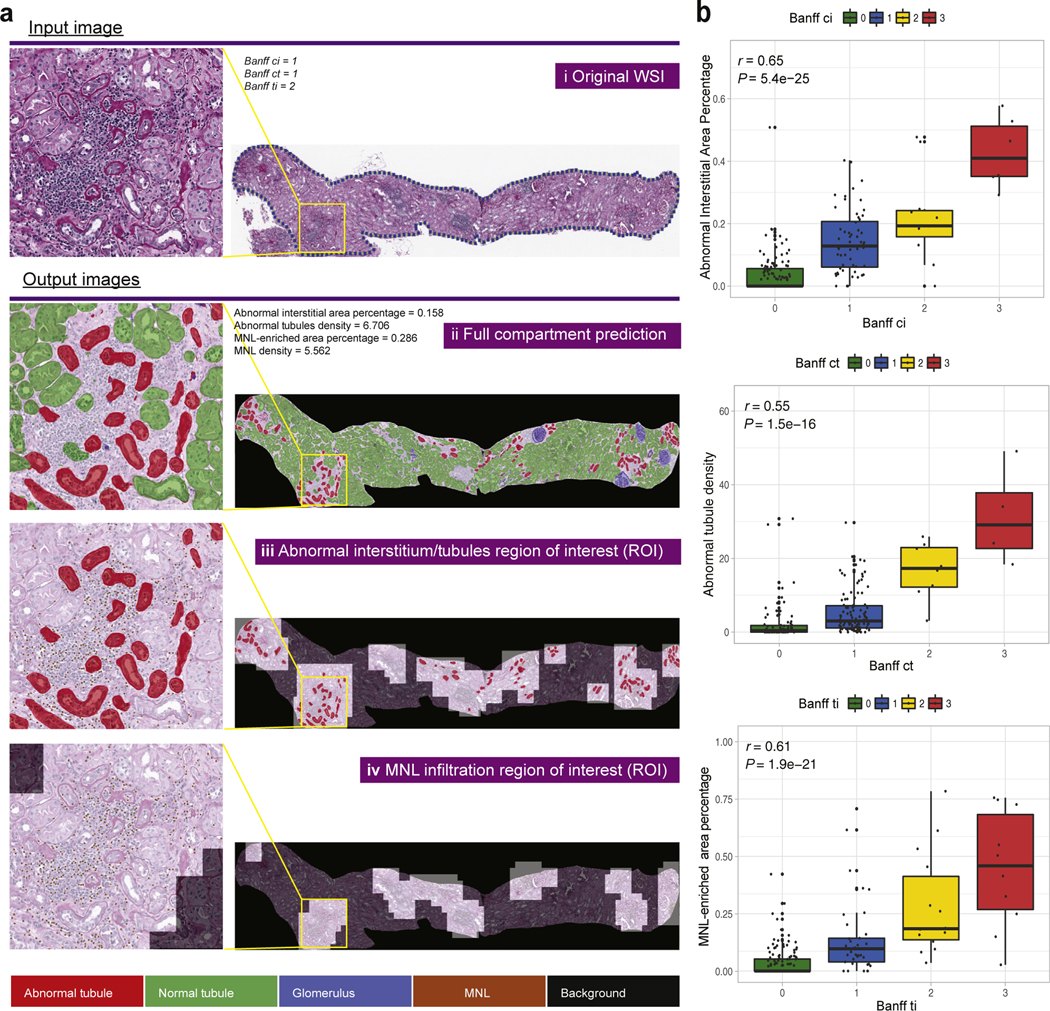
Figure 2 |. Demonstration of slide-wide digital features and correlation with corresponding Banff scores.
(a) Demonstration of slidewide digital features from the whole-slide image (WSI) investigation by an example WSI: (i) original WSI; (ii) whole-slide prediction; (iii) predicted abnormal interstitium or tubules regions of interest (ROIs); (iv) predicted mononuclear leukocytes (MNLs) infiltrated ROIs. Left panel shows zoom-in inspections of 1 particular abnormal region within the yellow box on the WSI. (b) Correlation of digital features with Banff scores. Correlation of abnormal interstitial area percentage and Banff ci score (top), abnormal tubules density and Banff ct score (middle), MNL-enriched area percentage and Banff ti score (bottom) in the Genomics of Chronic Allograft Rejection (GoCAR) 12-month post-transplantation biopsy slides (n = 200). P values were calculated from Spearman’s correlation test. To optimize viewing of this image, please see the online version of this article at www.kidney-international.org.

