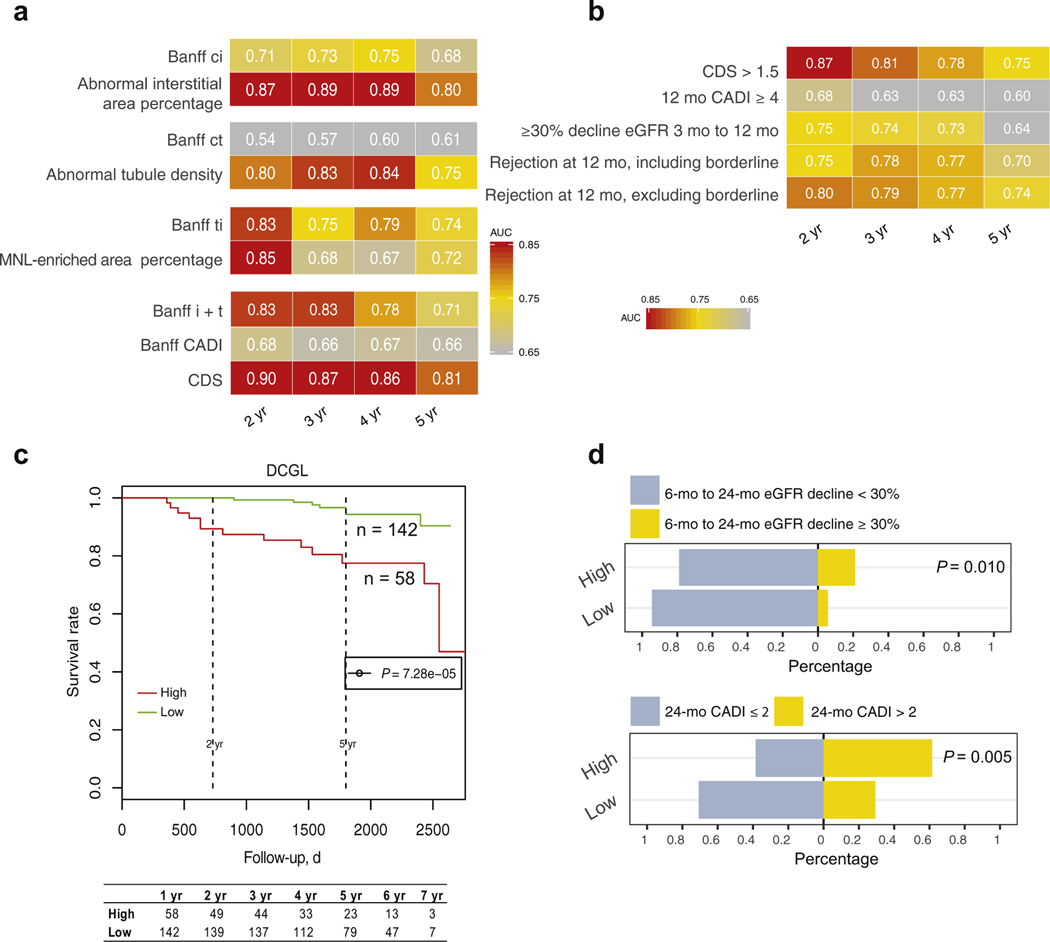
Figure 4 |. Association of 12-month post-transplant digital features with post-transplant graft outcomes in the Genomics of Chronic Allograft Rejection (GoCAR) cohort.
(a) Heat map of time-dependent area under the curve (AUC) values in predicting death-censored graft loss (DCGL) by Banff scores and digital features at different time intervals in 12-month post-transplant biopsy slides (n = 200). Numbers and yellow-red color range of boxes represent AUC values at given time points. (b) Heat map of time-dependent AUCs in predicting DCGL by the 12-month Composite Damage Score ([CDS], capturing the interstitial and tubular abnormality and mononuclear leukocyte [MNL] infiltration) high or low group and other pathologic or clinical (or both) factors that were obtained prior to or at 12 months. The 12-month CDS groups are defined as high, CDS > 1.5, and low, CDS ≤ 1.5. (c) Kaplan-Meier curves of the DCGL in high and low risk groups stratified by the 12-month CDS. P value is calculated by log-rank test. (d) Bar charts demonstrating proportions of 6-month to 24-month estimated glomerular filtration rate (eGFR) decline ≥30% or <30% (upper) and the 24-month post-transplant Chronic Allograft Damage Index (CADI) >2 or ≤2 (lower) between 12-month CDS risk groups. P values are calculated by Fisher’s exact test.

