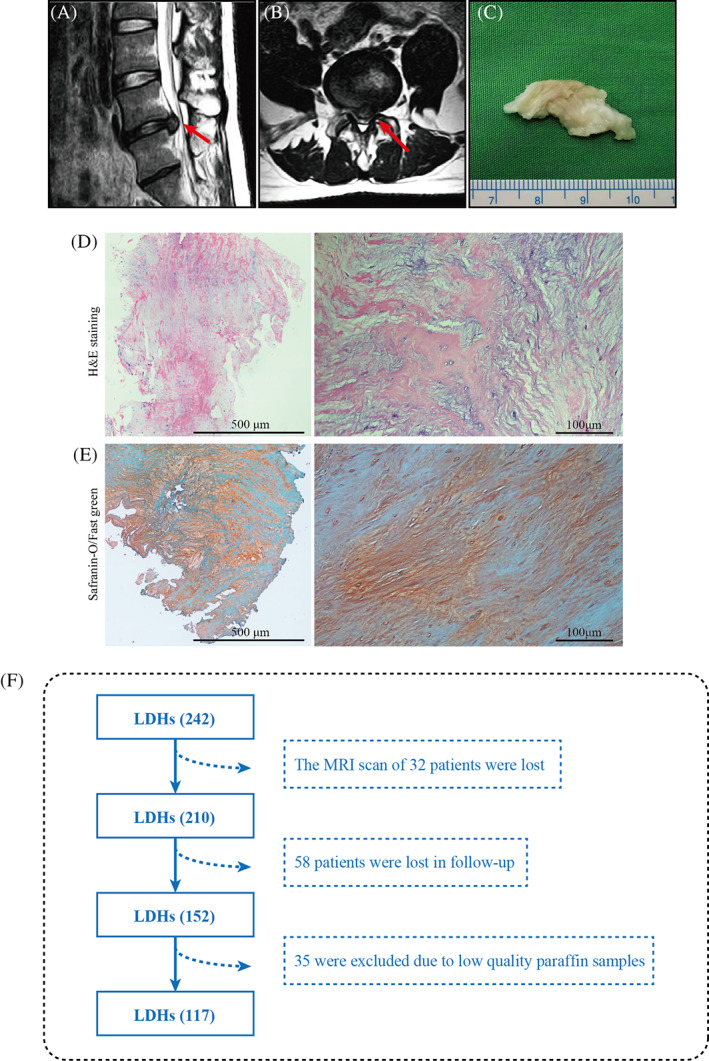
FIGURE 1.

An image of the nucleus pulposus (NP) and a flow diagram of the selection of patients with lumbar disc hernia (LDH) in the study. Magnetic resonance image (MRI) of the sagittal (A) and horizontal position (B) of the LDH patient is shown, with the red arrow indicating the herniated NP. General view (C), hematoxylin and eosin (H&E) staining (D), and Safranine O/Fast Green (E) of the herniated NP tissue. (F) Flow diagram of the selection of patients with LDH in the study.
