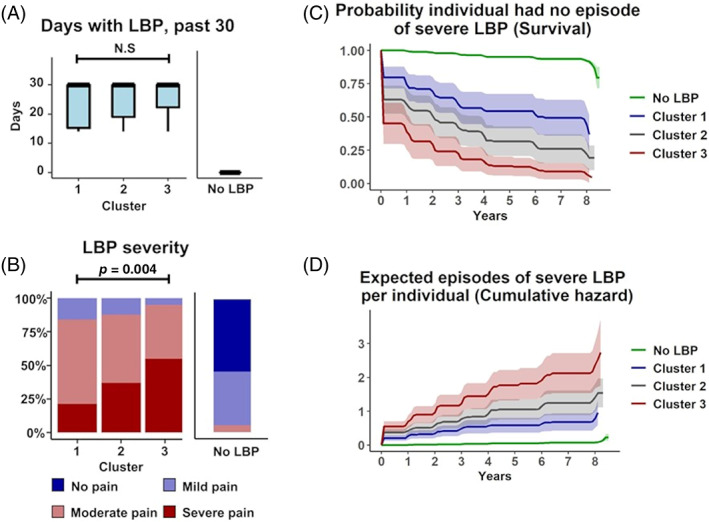
FIGURE 2.

Unsupervised learning identifies three LBP phenotypes with varying pain severity. (A) Days with activity‐limiting LBP at enrollment (screening variable). There were no significant differences between clusters. (B) LBP severity at enrollment. Cluster 3 has the highest proportion with severe LBP, followed by Cluster 2 and then Cluster 1. (C) Survival analysis over the 8‐year follow‐up period with an episode of LBP as the survival event. There were no differences between clusters. (D) Survival analysis over the 8‐year follow‐up period with an episode of severe LBP as the survival event. Cluster 3 had the worst survival outcomes. LBP, low back pain.
