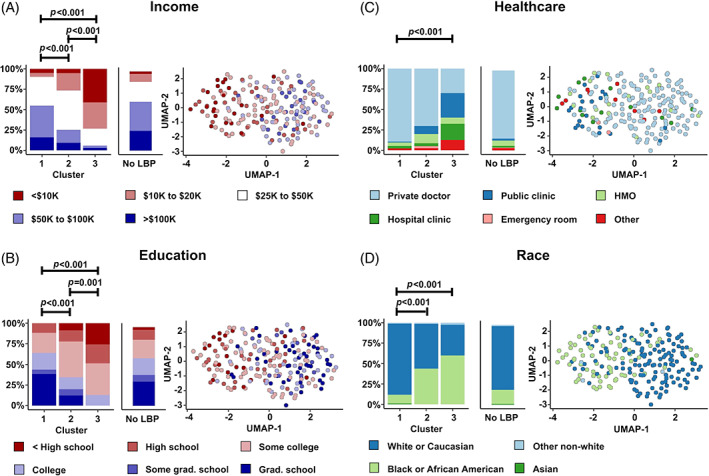
FIGURE 3.

Socioeconomic status and race distinguish clusters. Cluster 3 had the lowest socioeconomic status and were majority Black or African American, while Cluster 1 had the highest socioeconomic status and were majority white or Caucasian. Cluster 2 was an intermediate. (A) Annual income (V00INCOME). (B) Education (V00EDCV). (C) Type of healthcare (V00HLTHCAR). (D) Race (P02RACE). Grad., graduate; HMO, health maintenance organization; LBP, low back pain; UMAP, Uniform manifold approximation and projection.
