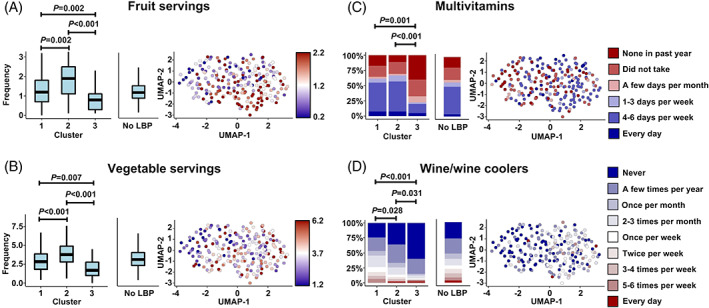
FIGURE 5.

Diet and nutrition variables distinguish clusters. Cluster 3 had the worst diet and nutrition compared to the other clusters but consumed the least alcohol (e.g., wine/wine coolers). (A) Daily servings of fruit (V00SRVFRT); (B) Daily servings of vegetables (V00SRVVEG); (C) Multivitamin use (V00MVIT1CV); (D) Wine/wine cooler consumption (V00FFQ71). LBP, low back pain; UMAP, Uniform manifold approximation and projection.
