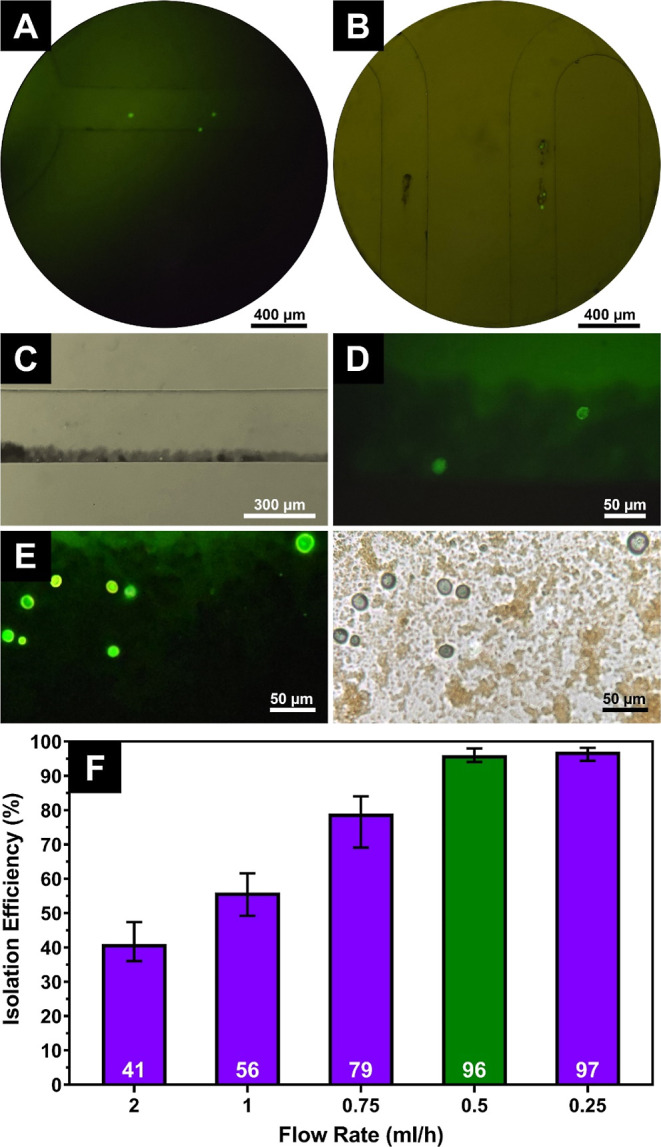
Figure 4.

Fluorescence microscopy images of on-chip cell isolation, (A,B) movement of stained SK-BR-3 cells and HER2-MNPs inside the chip, (C) magnetic enrichment of the cells attached to the HER2-MNPs in the trap region, (D) high magnification of fluorescent SK-BR-3 cells in the trap region, (E) fluorescence and bright-field images of SK-BR-3 cells separated after magnetic washing, and (F) SK-BR-3 cell isolation efficiency versus fluid’s flow rate inside the chip (the green bar shows the optimum flow rate value).
