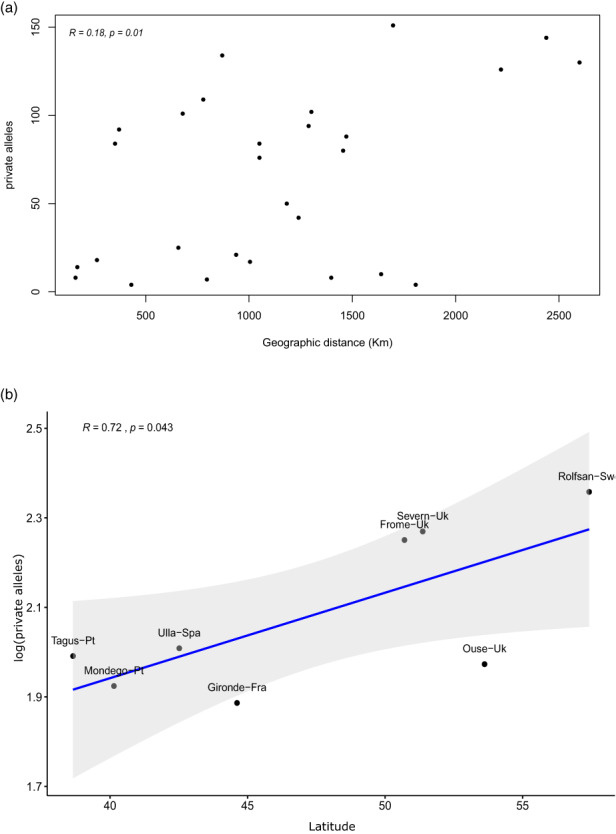
FIGURE 2.

Relationships between location‐specific alleles and geography. Panel a represents the relationship between the absolute number of private allele differences (x‐axis) as a function of geographic distance (y‐axis) between population pairs. Panel b investigates the relationship between latitude (x‐axis) and the log‐scaled number of private alleles (y‐axis) with sampled locations marked in the dots. Smooth bands of the linear model log(pa) ~ latitude were applied to aid the visualization of the trends.
