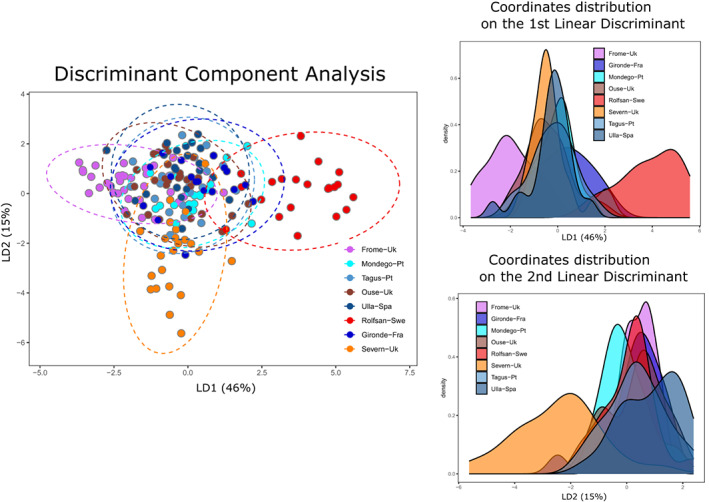
FIGURE 3.

Discriminant analyses of principal components (DAPC) with predefined population groups. Abstract distribution of individuals according to linear discriminant functions (1 and 2) that together captured 66% of genome‐wide variation. Ellipses in dashed lines represent the 95% confidence interval of a normal distribution of PCs.
