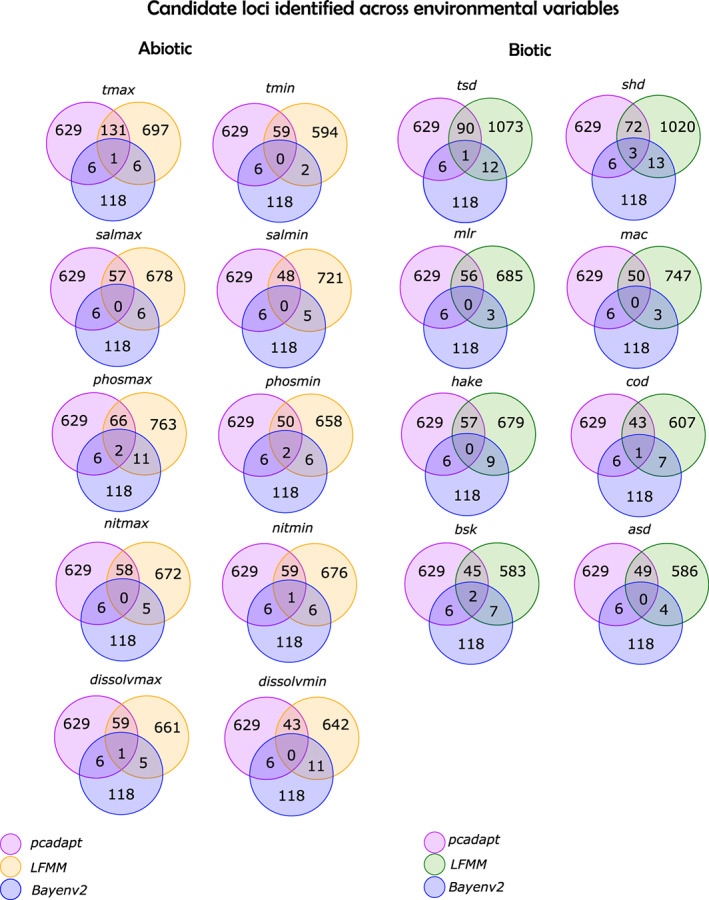
FIGURE 5.

Venn diagram of candidate loci identified by multiple outlier detection techniques. Shown here is the number of candidate loci identified by each software. LFMM approach implemented in the R package lea is colored in yellow for the abiotic variables and in green for the biotic variables.
