FIGURE 2.

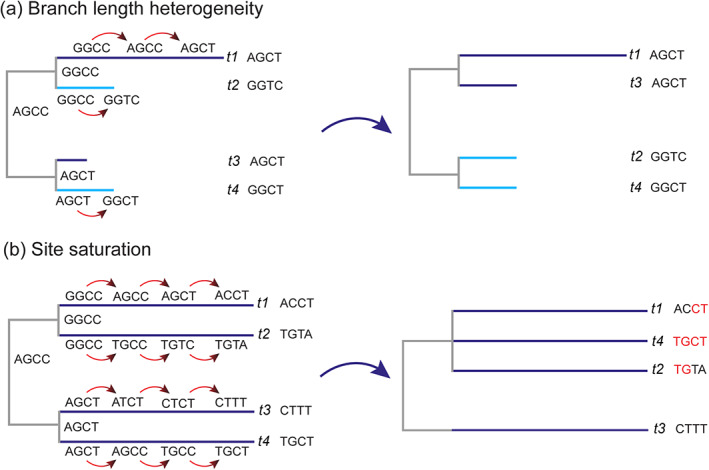
A figure depicting the key differences between branch length heterogeneity (Panel a) and site saturation (Panel b). The ‘true’ trees are depicted on the left, with the nucleotide changes along the branches, where the artefactual topologies are depicted on the right. In Panel a, multiple changes along the topmost branch t1 result in a nucleotide combination that resembles the short branch t3, which is likely to cause the two branches to resolve as sister to one another in phylogenetic reconstruction. Meanwhile, under site saturation (Panel b), any signal in the data has been lost due to multiple large changes occurring along branches t1–t4 within the lineage. The artefactual signal (highlighted in red) favours a polytomy of t1, t2 and t4 together, to the exclusion of t3.
