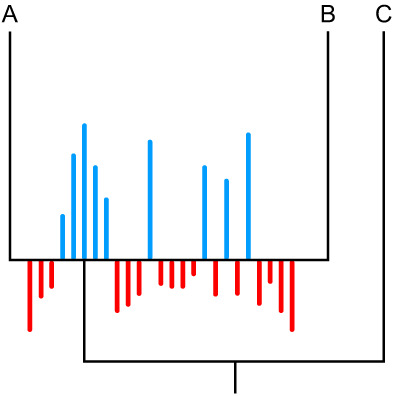
FIGURE 4.

A figure depicting PCS, an optimality criterion method. Each partition's support for the bipartition presented at the node is presented as a magnitude. Support for the bipartition presented is in blue and support against is in red. The length of the bars represents the strength of the support in favour or against the bipartition. This strength can be measured in log‐likelihood units, compatible quartets or other support metrics. In this worked example, though the majority of partitions do not support the topology, the partitions that do support the topology are more confident in that support. This might warrant further examination of the dataset to assess whether that confidence is artefactual.
