
Figure 3.
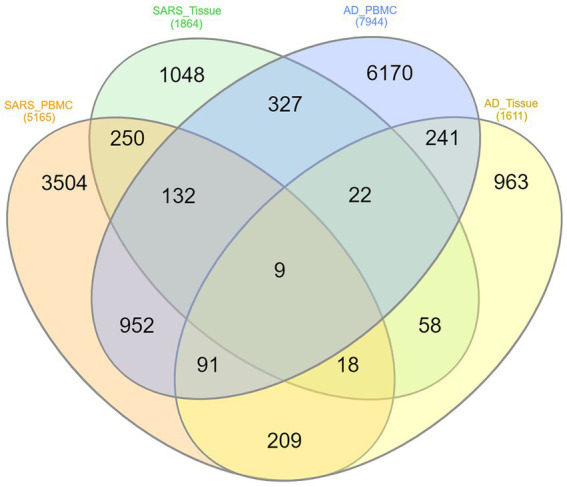
Venn diagram of shared differentially expressed genes, where each ellipse represents AD-PBMC, AD-Tissue, COVID-19-PBMC, and COVID-19-Tissue with Nine (HST6, POLR3G, SLC6A20, ITGA2B, HOMER3, GMPR, AGBL1, CRABP2, OLFML2B) genes common among the four groups.