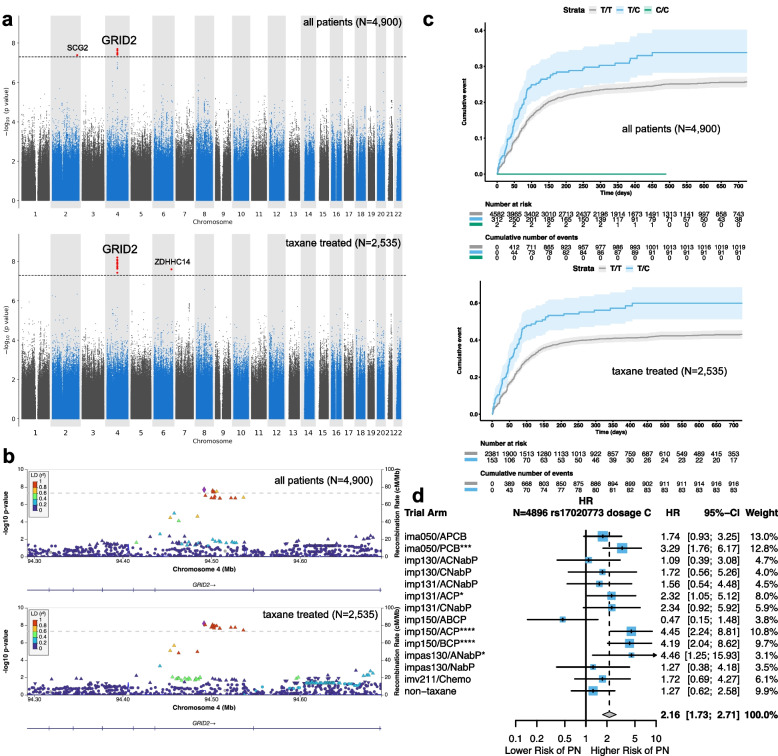
Fig. 1.
GWAS of time-to-first peripheral neuropathy (PN) event across clinical trials in whole genome sequencing data from European ancestry cancer patients identifies genome-wide significant loci. a Manhattan plot showing -log10 p-values testing for association between common (MAF > 0.01) genetic variants and time-to-first PN event using a Cox proportional hazards model for all patients (top) and for taxane-treated patients (bottom). SNPs reaching genome-wide significance are highlighted in red. Horizontal dashed line shows the genome-wide significance cutoff (p < 5 × 10⁻⁸). The GRID2 locus is indicated above. b Locus zoom plot around the GRID2 intron locus for all patients (top) and for taxane-treated patients (bottom). The colors indicate the strength of linkage disequilibrium (r.2) relative to the index SNP (rs17020773) shown as a purple diamond. c Cumulative incidence plot showing the association between dosage of the effect allele of rs17020773 and time-to-PN event for all patients (top) and for taxane-treated patients (bottom). Shaded regions designate the 95% confidence intervals around the cumulative incidence curves. Note that the 2 homozygous carriers of the rs17020773 variant were from trial arms that did not receive chemotherapies. d Forest plot illustrating the 95% confidence intervals around the hazard ratio (HR) associating the dosage of the alternate C allele of rs17020773 to time to first PN event. The non-taxane trial arms have been grouped. Trial arm and treatment abbreviations are provided in Table 1. The inverse variance weighted HR is provided as a diamond. *p < 0.05, **p < 0.01, ***p < 0.001, ****p < 0.0001

