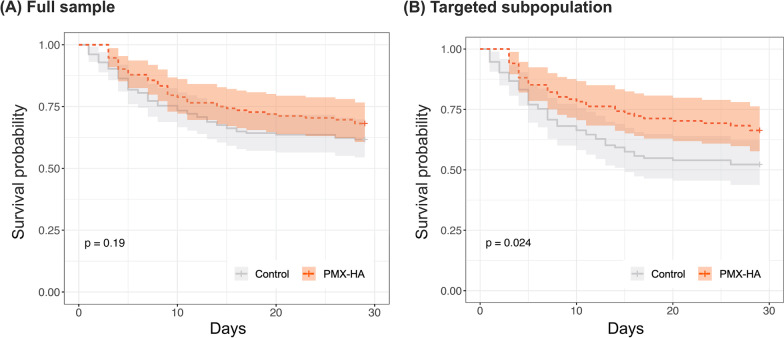
Fig. 3.
Kaplan–Meier curves of patients in all and targeted population of the validation cohort. Legend: Shown are unadjusted Kapan–Meier curves of patients in A all and B targeted population of the validation cohort. “Targeted subpopulation” indicates patients with PT-INR > 1.4 or lactate > 3 mmol/L on ICU admission. P values were estimated by the log-rank test. The hazard ratios up to 28 days using the Cox proportional hazard model, adjusted for baseline APACHE II and SOFA scores, are 0.71 (95% CI [0.48 to 1.06], p = 0.10) and 0.62 (95% CI [0.40 to 0.95], p = 0.03) in all and targeted population, respectively. PMX-HA = Polymyxin B Hemadsorption, PT-INR = Prothrombin Time and International Normalized Ratio, APACHE II score = Acute Physiology and Chronic Health Enquiry II score, SOFA score = Sequential Organ Failure Assessment

