FIG 3.
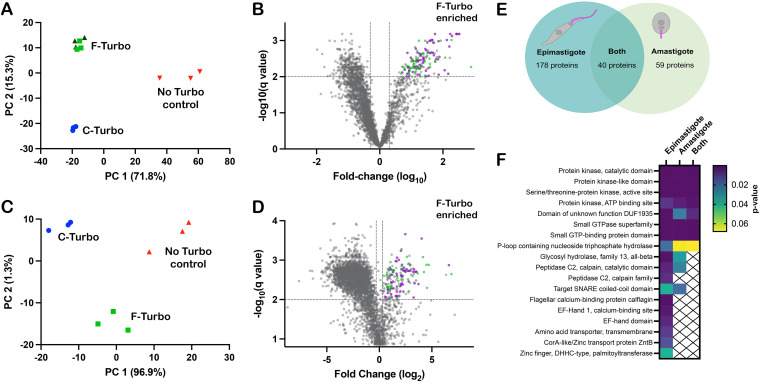
Proximity proteome analysis identifies enriched flagellar proteins in T. cruzi. Principal-component analysis (PCA) of biotinylome data plotted for WT (no TurboID control), flagellar-TurboID (F-Turbo) and cytosolic-TurboID (C-Turbo) for T. cruzi epimastigotes (A) and intracellular amastigotes (C). The two independent F-Turbo groups in the epimastigote PCA plot are represented in green (triangles and squares). Volcano plots (B and D) with fold change (F-Turbo versus C-Turbo; x axis) and adjusted P value (q value; y axis) for T. cruzi epimastigote (B) and amastigote (D) proteomic data. Horizontal lines represent a q value of 0.01, and the two vertical lines indicate the cutoffs for fold change (2-fold). The top right quadrants in each plot (B and D) contain proteins that are significantly enriched in F-Turbo proteomes (q ≤ 0.01, ≥2-fold change). Known trypanosomatid flagellar proteins (purple circles) and hypothetical proteins (green circles) are shown for the F-Turbo enriched proteins. (E) Venn diagram depicting the number of proteins identified as enriched in the F-Turbo samples of T. cruzi epimastigote and amastigote stages. (F) Interpro domains assigned by DAVID that are significantly enriched in F-Turbo samples (i.e., proteins found in the upper right quadrant of each volcano plot) in epimastigotes and amastigotes and those common to both life stages. P values are from a modified Fisher exact test for protein enrichment analysis.

