Figure 2.

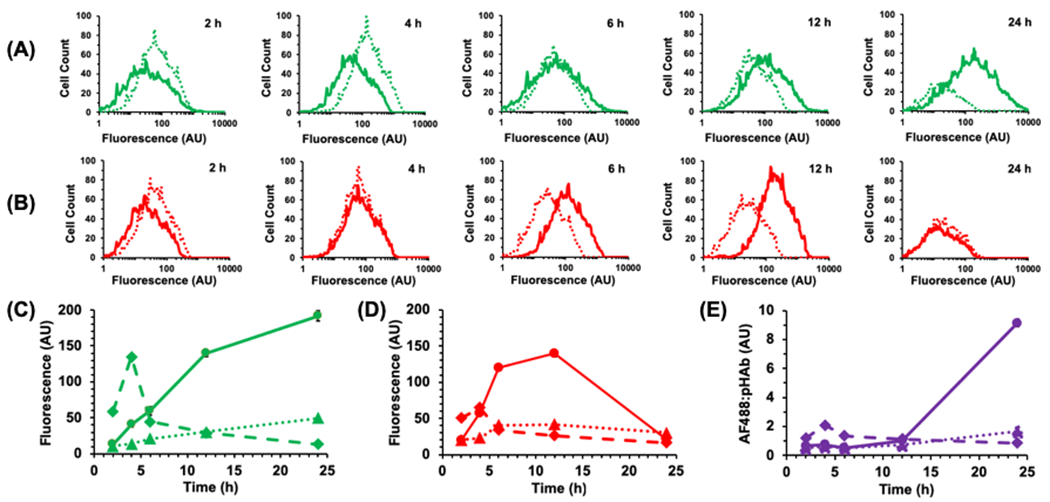
Representative flow cytometry histograms of MDA-MB-468 cells showing the change in fluorescence intensity of (A) AF488 and (B) pHAb conjugated to N23BP-CodA (solid line) and WT-CodA (dotted line) at various times after incubation. Samples were irradiated at the 3 h mark; 2 h samples were not irradiated. Samples were run in triplicate (n=3), but representative plots are shown for clarity. (C, D) Change of mean fluorescence intensity with time of (C) AF488 and (D) pHAb conjugated to N23BP-CodA (solid line) and WT-CodA (dashed line). Dotted line shows fluorescence from N23BP-CodA with EGF added. (E) Ratio of AF488:pHAb fluorescence for N23BP-CodA (solid), WT-CodA (dashed), and N23BP-CodA + EGF (dotted) as function of time. For C-E, error bars represent standard error; in some cases, the error range is smaller than the data marker.
