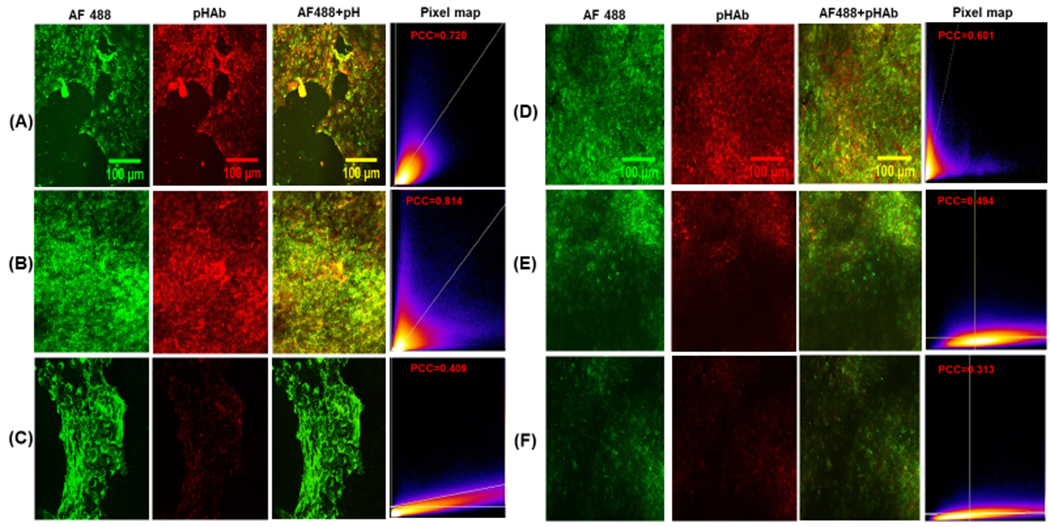
Figure 3.

(A-C) Confocal microscopy images of MDA-MB-468 breast cancer cells treated with AF488-pHAb-N23BP-CodA for (A) 4 h, (B) 12 h, and (C) 24 h. The pixel map shows the colocalization of the two dyes (x: green, y: red) with the reported Pearson Correlation Coefficient (PCC). (D-F) Confocal microscopy images of MDA-MB-468 breast cancer cells treated with AF488-pHAb-WT-CodA for (D) 4 h, (E) 12 h, and (F) 24 h, with pixel map showing colocalization and PCC.
