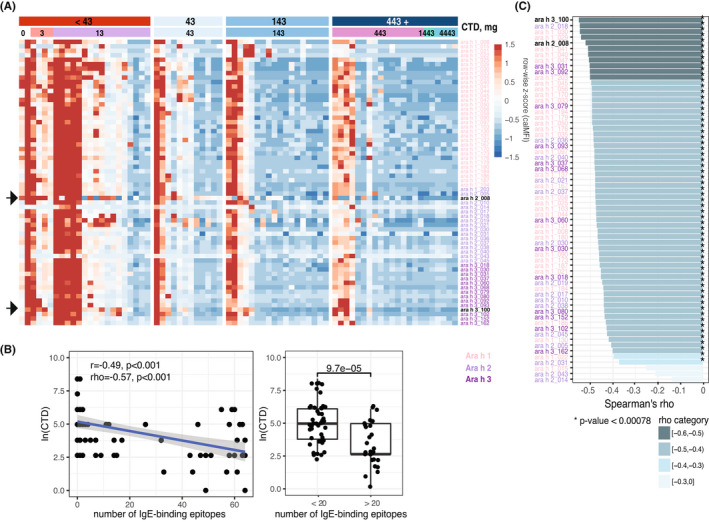
FIGURE 2.

Ses‐IgE association with the CTD. (A) Patient‐specific heatmap with samples as columns and 64 ses‐IgEs as rows; represented as row‐wise z‐score of CalMFI (red – high level, blue – low). (B) Association of CTD (natural log) and a number of IgE‐binding epitopes for each subject as a scatterplot (left) or boxplot (right, Wilcoxon rank sum test p‐value). (C) Correlation of each of the 64 ses‐IgE with the CTD (color represents rho coefficient's magnitude, star if the p‐value is significant after Bonferroni correction).
