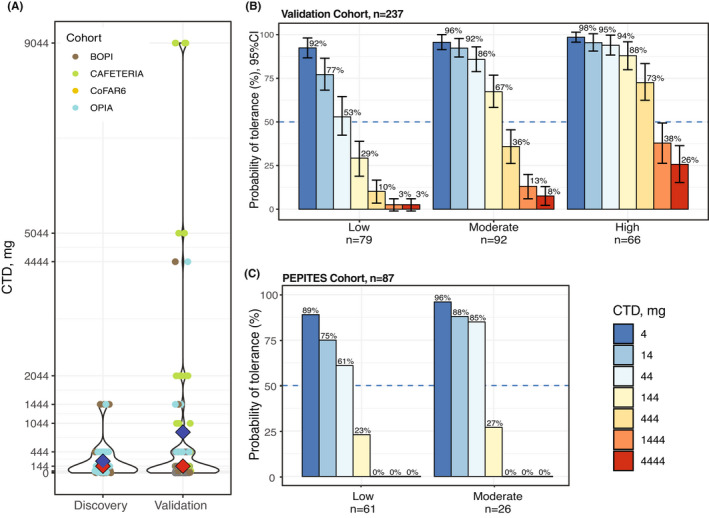
FIGURE 4.

Dose‐reactivity groups and probabilities of tolerance. (A) Distribution of CTDs shown as a violin plot, colored by four cohorts (blue diamond – mean, red – median). (B) Bar chart of probabilities with 95% CI of tolerance at each peanut dose for “low”, “moderate”, and “high” dose‐reactivity groups in 237 Validation subjects. (C) Bar chart of probabilities of tolerance at each peanut dose for “low” and “moderate” reactivity groups in 87 PEPITES subjects (only seven subjects were assigned to the “high” group, not shown). In PEPITES, the maximum dose administered during DBPCFC was 300 mg.
