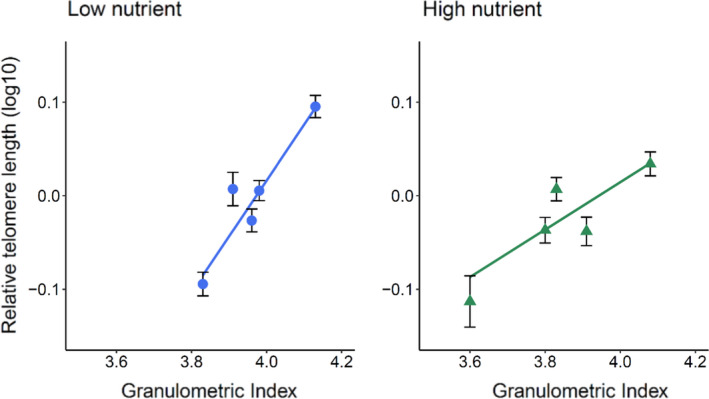
FIGURE 3.

The relationship between a stream's mean granulometric index and the relative telomere length of the focal salmon (aged 1+ years old) captured within that stream. Data plotted as the mean of each stream ± 1SE, and regression line. Blue circles represent individuals from low nutrient streams (n = 216), while green triangles represent individuals from the high nutrient streams (n = 197). See Table 2
