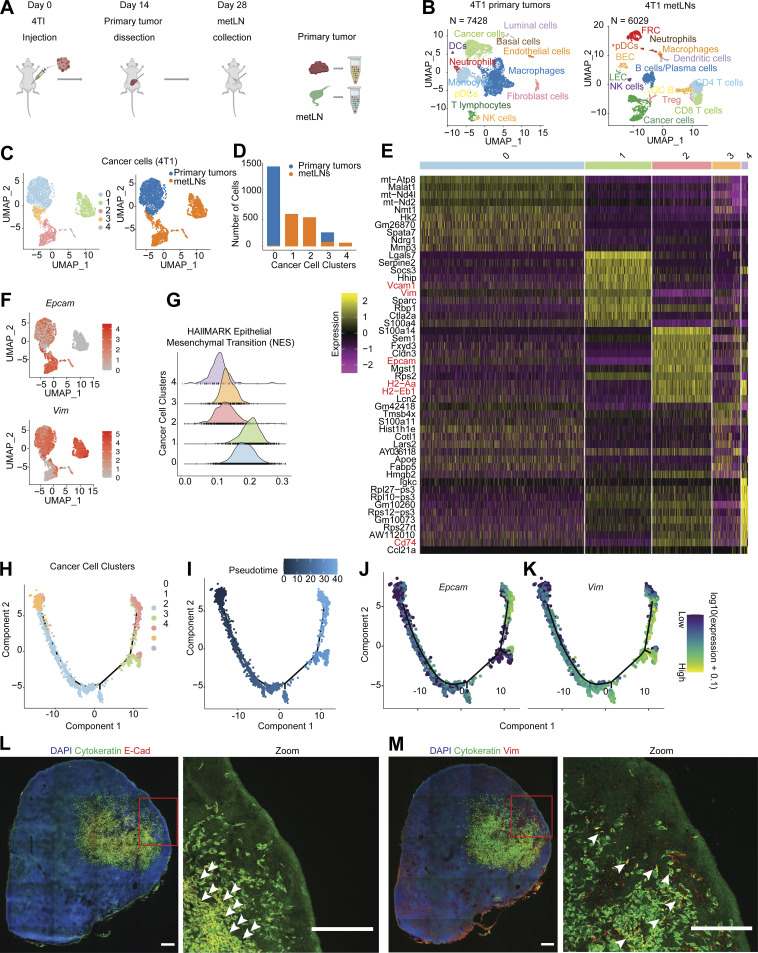
Figure 1.
Single-cell RNA-Seq identified EMT-plasticity of cancer cells in 4T1 primary tumors and metLNs. (A) Pipeline for single-cell RNA-Seq library preparation. 4T1 cells (1 × 10⁵) were injected into the fourth mammary fat pad of female Balb/c mice (6–10 wk old). Primary tumors were dissected and dissociated into single cells for 10X Genomics Chromium Single Cell 3′ library preparation when they reached 500 mm3 or on day 14. 14 d after primary tumor resection, tumor metLNs were collected, digested into single cells, and processed by the 10X Genomics platform. The Illumina NextSeq platform was used for sequencing. This experiment was repeated with triplicates, and samples from four mice were combined in each cohort. (B) UMAP plot of distinct cell types in the microenvironment of 4T1 primary tumors (left) and metLNs (right). (C) UMAP plot of aggregated cancer cells (n = 3,007) from primary tumors and metLNs after cell cycle regression. The plot on the left is colored by original cluster names, and the plot on the right is colored by samples. The top 20 PCs were chosen for UMAP analysis, and the minimum distance is 0.5. (D) Bar plot showing the number of cancer cells in each cluster from C. (E) Heatmap of single-cell gene expression of the top 10 differentially expressed genes in cancer cells. The color bar above the heatmap is the same color code as in C. In the heatmap, purple represents low expression, and yellow represents high expression. (F) UMAP plot of gene expression of epithelial cell marker gene (EpCAM) and mesenchymal cell marker gene (Vim) in cancer cells. Gene expression values are log-normalized, gray represents low expression, and red represents high expression. (G) Histogram of the single-cell enrichment score of MSigDB Hallmark EMT gene set. (H) The single-cell trajectory of cancer cells colored by original cluster identities. (I) The pseudotime trajectory of cancer cells, with the early stage represented by dark color and the late stage represented by bright color. (J and K) Expression of EpCAM and Vim projected onto the single-cell trajectories. Gene expression values are scaled and log-normalized. (L and M) Representative confocal microscopy images of immunofluorescence staining of cytokeratin, E-cadherin, and vimentin in 4T1 metLNs. Two adjacent tissue sections from the same lymph node were used for staining. The tissue section thickness is 10 μm. Scale bars represent 200 μm in all the images, and the red rectangle indicates the enlarged view. The white arrowheads indicate the cytokeratin and E-Cadherin–positive cells in L, and cytokeratin and vimentin–positive cells in M.

