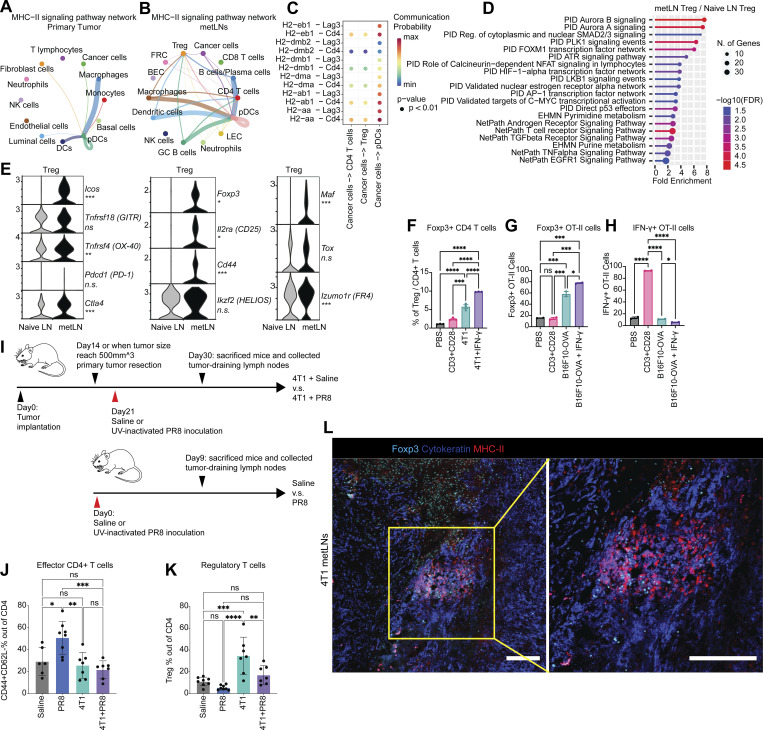
Figure 4.
MHC-II–positive cancer cells mediated the enrichment of tolerogenic Treg cells in lymph nodes through energy. (A and B) Single-cell MHC-II signaling pathway network in (A) 4T1 primary tumor and (B) metLNs. The cell–cell interaction analysis was performed by CellChat. (C) MHC-II signaling pathway ligand–receptor interactions between cancer cells and CD4+ T cells, Treg, and pDCs. (D) Functional annotation of upregulated genes in Tregs in metLNs by ShinyGO. (E) The single-cell gene expression of Treg cell–associated genes. (F) The percentage Tregs when cocultured with or without 4T1 cancer cells. 4T1 cells were pretreated with or without IFN-γ (10 ng/ml) for 48 h before the coculture assay. (G) The percentage of Foxp3+ OT-II T cells in the in vitro co-culture assay. (H) The percentage of IFN-γ+ OT-II T cells in the in vitro co-culture assay. B16F10-OVA cells were pretreated with or without IFN-γ (10 ng/ml) for 48 h before the coculture assay. (I) The experiment design of UV-inactivated influenza virus PR8 inoculation assay. (J and K) The percentage of (J) effector CD4+ T cells and (K) Tregs in the draining lymph nodes from UV-inactivated PR8 influenza virus inoculation assay. (L) Immunofluorescence staining of Foxp3 (cyan), pan-cytokeratin (blue), and MHC-II (red) in 4T1 metLNs. The scale bar represents 200 μm in all images. The yellow rectangle indicates the region of interest at a higher magnification.

