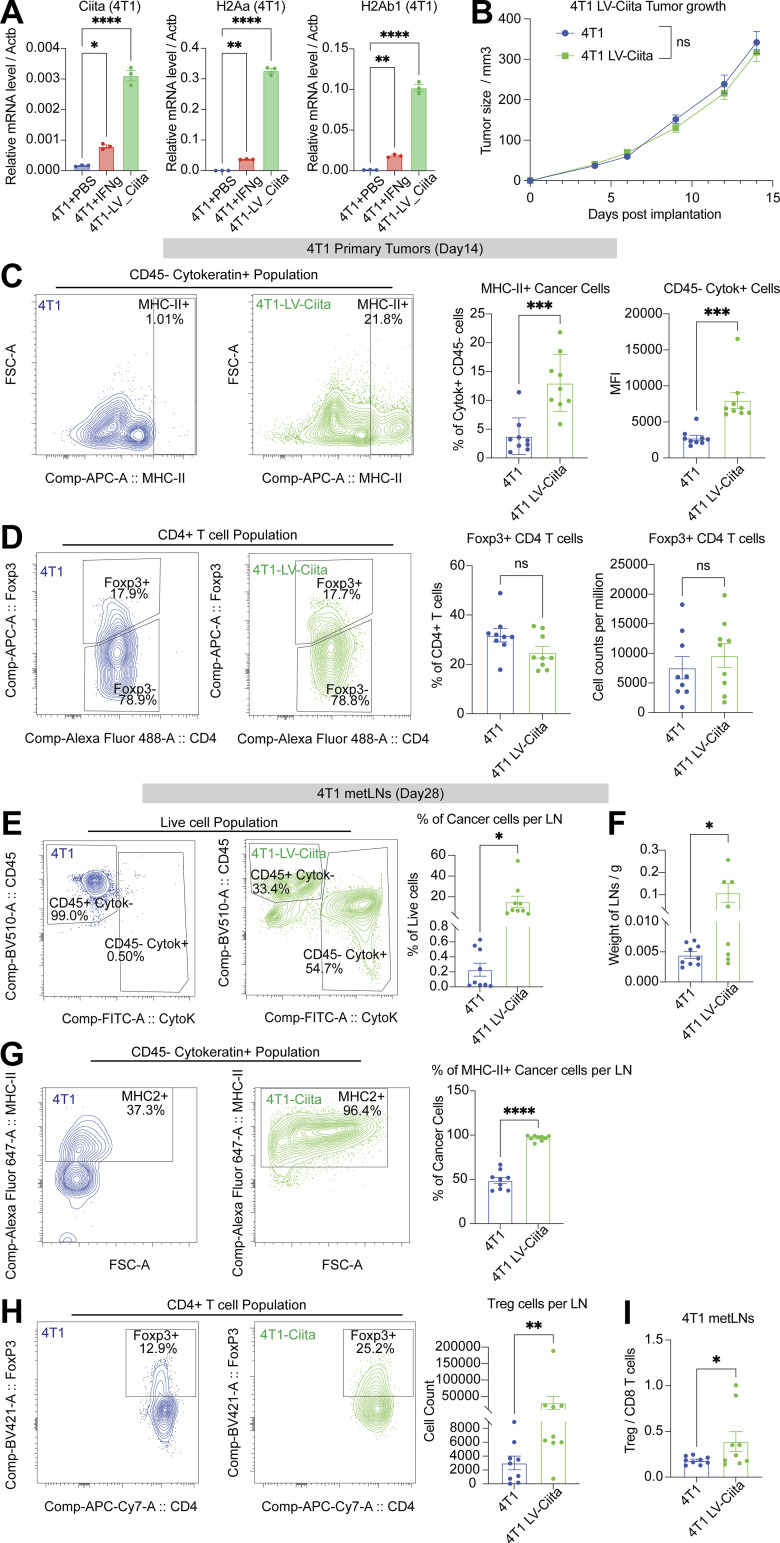
Figure 6.
Overexpression of Ciita in cancer cells accelerates LNM. (A) Ciita overexpression significantly enhances MHC-II gene expression in cancer cells compared with control cells. One-way ANOVA was used for statistical analysis, and Tukey’s multiple comparisons test was used for the post-hoc test. (B) Ciita overexpression in 4T1 cancer cells does not significantly alter primary tumor growth in Balb/c mice compared to WT 4T1 cells. (n = 9 per group). Student’s t test was used for the statistical analysis. (C) Flow cytometry analysis demonstrates increased cell surface expression of MHC-II in cancer cells of primary tumors with Ciita overexpression compared to control tumors. (D) Flow cytometry analysis shows no significant difference in the proportion of Treg cells in primary tumors with Ciita overexpression compared with control tumors. Student’s t test was used for the statistical analysis. (E) Flow cytometry analysis shows an increase in the proportion of cancer cells in metLNs with Ciita overexpression compared to control tumors. (F) metLNs from mice injected with Ciita-overexpressing cancer cells in the mammary fat pad have significantly more weight than metLNs from control tumor-bearing mice. (G) Flow cytometry analysis demonstrates an increase in the proportion of MHC-II+ cancer cells in metLNs with Ciita overexpression compared to control tumors. (H) Ciita overexpression leads to an increase in the number of Treg cells in metLNs compared with control tumors, as demonstrated by flow cytometry analysis. (I) Flow cytometry analysis shows a significant increase in the ratio of Treg cells to CD8 T cells in metLNs with Ciita overexpression compared to control tumors. Student’s t test was used for statistical analysis; *, P < 0.05; **, P < 0.01; ***, P < 0.001; ****, P < 0.0001.

