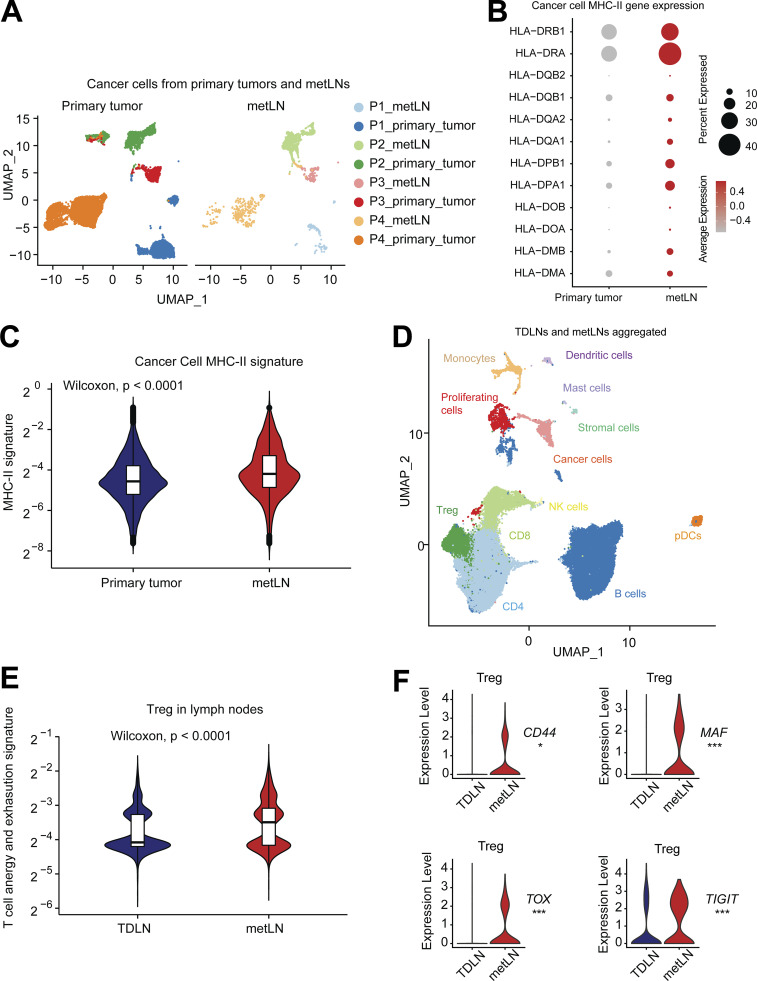
Figure 7.
Plasticity of T cell states in human breast cancer progression and metastasize to lymph nodes. (A) The UMAP of 14,646 aggregated cancer cells from human primary breast tumors and metLNs. The aggregated cancer cell UMAP is separated into primary tumors (left) and metLNs (right) for visualization. We selected the top 30 PCs for the UMAP analysis with a minimum distance of 0.5 for the display. (B) The expression profiling of MHC-II genes in cancer cells from primary tumors and metLNs. Red represents high expression, and gray represents low expression. The size of the circle represents the proportion of cells expressing the indicated genes in each cluster. (C) The MHC-II gene signature in cancer cells from primary tumors and metLNs. Single-cell MHC-II signature score was measured by UCell. (D) The UMAP of cells from TDLNs and metLNs, colored by cell types. (E) Violin plot shows the anergy and exhaustion gene signature in Tregs in TDLNs and metLNs from all the patients. Gene expression signature score was measured by UCell. The CD4+ T cell anergy and exhaustion genes were generated by Trefzer et al. (2021). (F) Violin plots show the gene expression of CD44, MAF, TOX, and TIGIT in Treg cells in the lymph nodes. Wilcoxon rank-sum test was used for statistical analysis; *, P < 0.05; **, P < 0.01; ***, P < 0.001.

