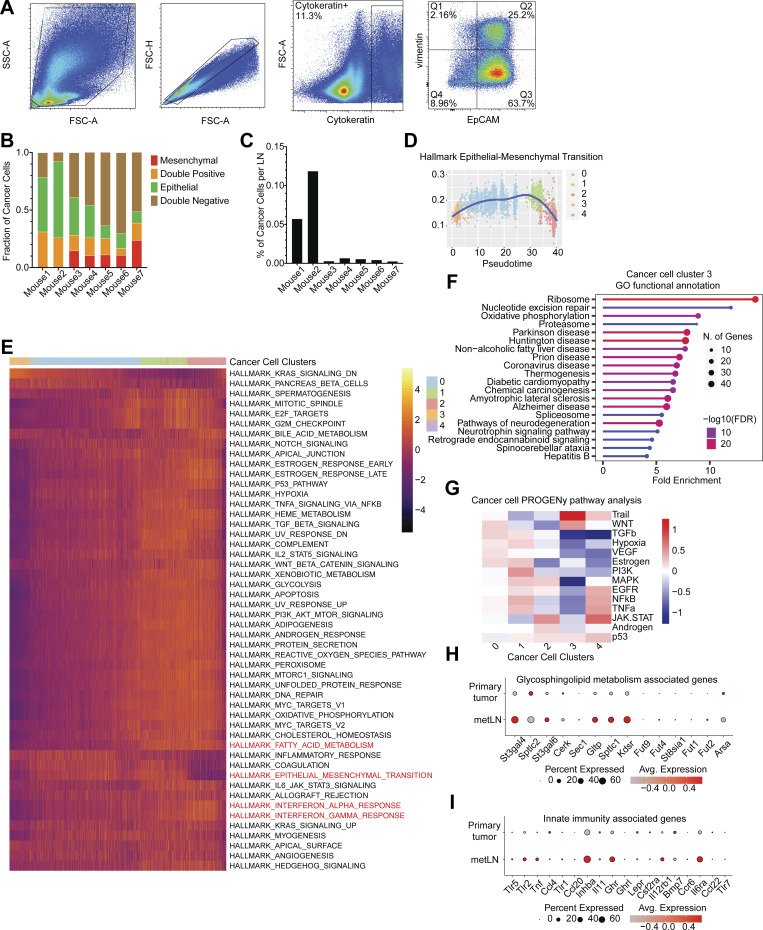
Figure S2.
The plasticity of cancer cells during LNM. (A) The representative flow cytometry gating strategy of EMT profiles of 4T1 cancer cells in metLNs. Cytokeratin (Alexa-488), EpCAM (APC-Cy7), vimentin (PE). (B) Percentage of EpCAM+vimentin− (epithelial), EpCAM−vimentin+ (mesenchymal), EpCAM−vimentin− (double-negative), and EpCAM+vimentin+ (double-positive) cancer cells compared with all cancer cells (cytokeratin+) in metLNs. (C) Percentage of cancer cells in metLNs measured by FACS. (D) The single-cell enrichment score of MSigDB Hallmark EMT gene set. Cancer cells were ranked by pseudotime, and the blue line represents the loess regression of the enrichment score. (E) The single-cell gene set enrichment analysis of cancer cells in 4T1 primary tumors and metLNs. The gene sets are from GSEA MSigDB hallmark gene sets. Each column represents a single cell, and each row represents a gene set. Cancer cells were ranked by pseudotime. Yellow represents high, and purple represents low. (F) GO functional annotation of upregulated genes in cluster 3 4T1 cancer cells. (G) PROGENy pathway analysis of differentially expressed genes in cancer cells from our murine datasets. (H and I) Single-cell gene expression of glycosphingolipid metabolism (H) and innate immunity associated genes (I) was examined using data from a previous publication on human TNBCs (Karaayvaz et al., 2018). Gene expression levels were log-normalized, and gray indicates low expression while red indicates high expression. The size of the circle represents the percentage of cells in each cluster that expressed the labeled genes.

