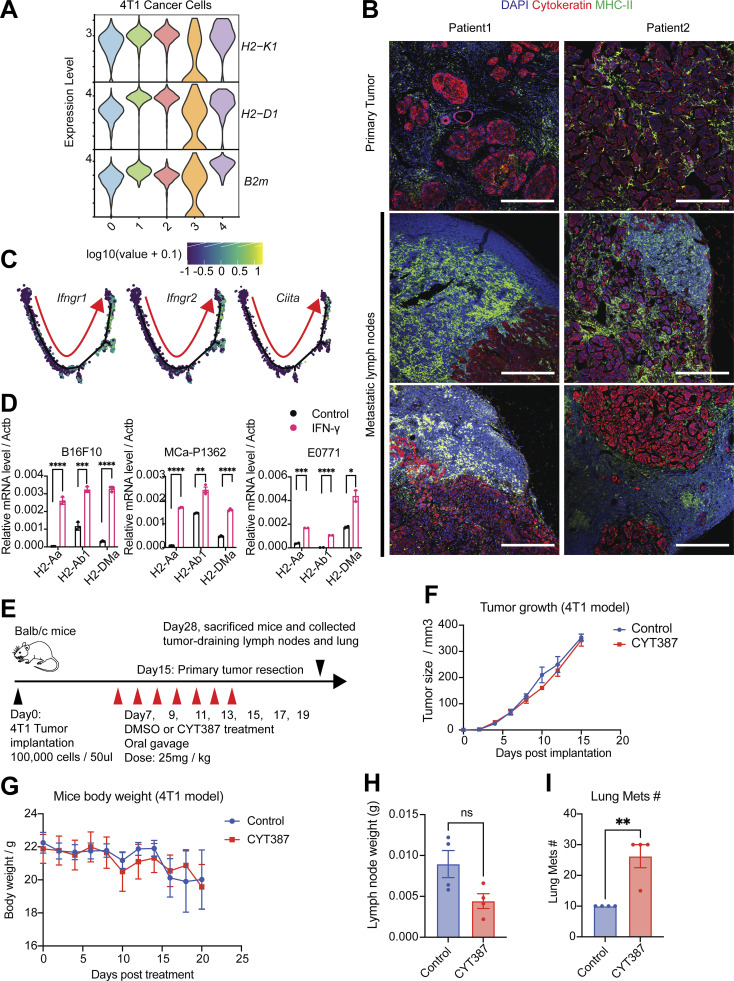
Figure S3.
The elevation of the IFN-γ signaling pathway drives MHC-II expression in cancer cells. (A) The violin plot shows the gene expression of MHC-I molecules in 4T1 cancer cells from all clusters. (B) Immunofluorescence staining of nuclei (DAPI, blue), pan-cytokeratin (red), and MHC-II (green) in human breast tumors and metLNs in formalin-fixed paraffin-embedded specimens. The thickness of the sections is 5 μm. The scale bar represents 500 μm in all images. The deidentified breast tumor samples were provided by the Massachusetts General Hospital pathology department. (C) The gene expression of Ifngr1, Ifngr2, and Ciita were projected to the single-cell pseudotime trajectories. Gene expression values are scaled and log-normalized. The red arrow indicates the pseudotime trajectory of cancer cells progression. (D) IFN-γ induces the expression of MHC-II molecules H2-Aa, H2-Ab1, and H2-DMa in vitro. B16F10 (melanoma), MCa-P1362 (breast cancer), and E0771 (breast cancer) cells were treated with or without IFN-γ (10 ng/ml) for 24 h. Student’s t test was used for statistical analysis; *, P < 0.05; **, P < 0.01; ***, P < 0.001; ****, P < 0.0001. (E) The experimental design of the JAK/STAT inhibitor CYT387 in vivo assay. (F) 4T1 tumor growth in control and CYT387 treatment groups (n = 4). (G) Mice body weight change in control and CYT387 treatment groups (n = 4). (H) The weight of the TDLNs at day 28. (I) The number of lung metastases at day 28. Student’s t test was used for the statistical analysis.

