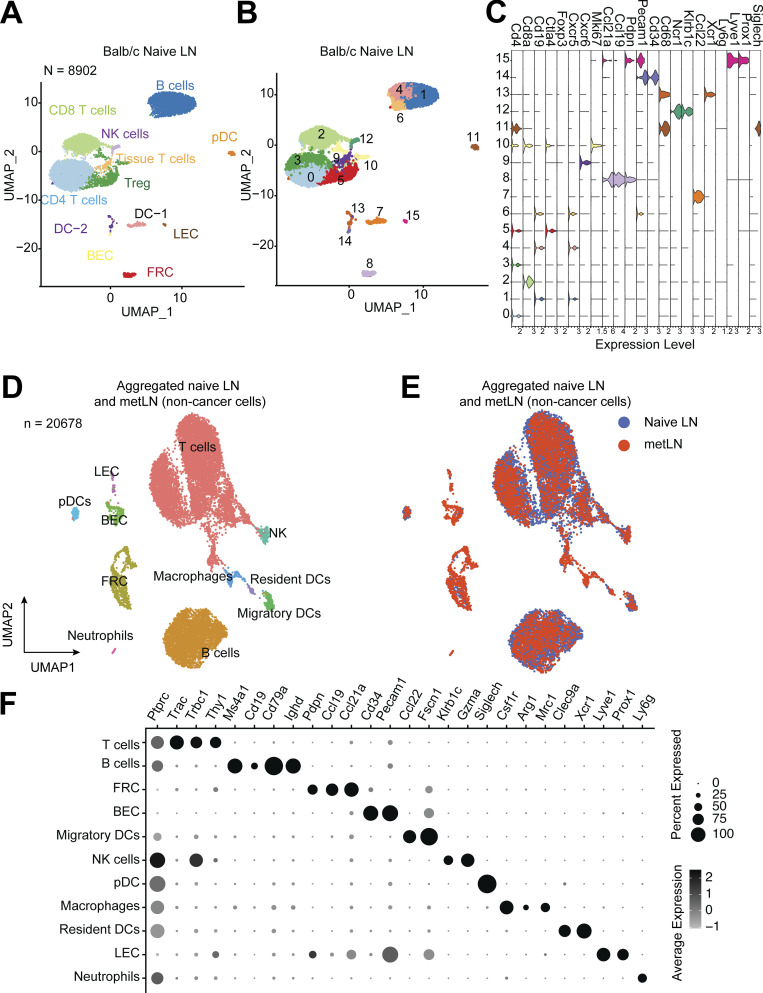
Figure S4.
The single-cell atlas of inguinal lymph nodes in naive Balb/c mice. (A and B) The UMAP of 8,902 cells from inguinal lymph nodes in tumor-free Balb/c mice (naive mice), (A) colored by the cell types, (B) colored by the clusters. We selected the top 30 PCs for the UMAP analysis with a minimum distance of 0.5 for the display. The resolution for the UMAP clustering is 0.8. (C) Violin plots show the gene expression levels of selected marker genes in each cluster of cells from naive lymph node. Gene expression values are log-normalized. (D) The UMAP of aggregated cells in naive lymph nodes and 4T1 metLNs (n = 20,678). Top 30 PCs were chosen for the UMAP analysis, with a minimum distance of 0.5 and clustering resolution of 0.8, and cells were colored by main cell types in the lymph nodes. (E) The UMAP of aggregated cells in naive lymph nodes and 4T1 metLNs grouped by the samples. (F) The gene expression pattern of selected marker genes in the main cell types in the lymph nodes. Black represents high expression, and gray represents low expression. The size of the circle represents the proportion of cells expressing the indicated genes in each cluster.

