Figure S5.
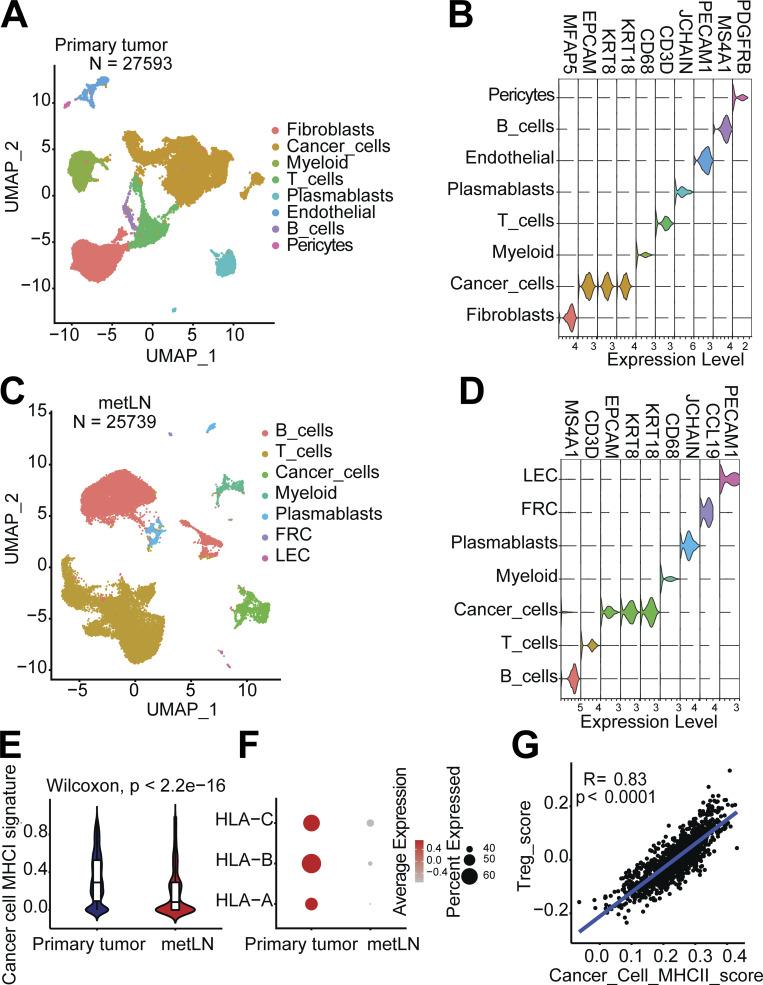
The single-cell atlas of human breast cancer and metLNs, and TCGA BRCA dataset analysis. (A) The UMAP of 27,593 cells from human breast tumors from NCBI GEO database GSE180286. We selected the top 30 PCs for the UMAP analysis with a minimum distance of 0.5 for the display. The resolution for the clustering is 0.5. (B) Violin plots show the gene expression levels of cell type-specific marker genes in breast tumors. (C) The UMAP of 25,739 cells from breast cancer metLNs from NCBI GEO database GSE180286. We selected the top 30 PCs for the UMAP analysis with a minimum distance of 0.5 for the display. The resolution for the clustering is 0.5. (D) Violin plots show the gene expression levels of cell type–specific marker genes in metLNs. (E) Violin plots show the MHC-I gene signature in cancer cells. (F) The expression profiling of MHC-I genes in cancer cells. (G) The correlation between Treg signature score and cancer cell MHC-II score in the TCGA breast cancer dataset. We retrieved the TCGA BRCA gene expression dataset using the TCGAbiolinks R package (Colaprico et al., 2016). The Treg cell signature score was defined based on the expression of CD4, FOXP3, and CTLA4, while the cancer cell MHC-II signature score was defined based on the expression of cytokeratin (KRT8 and KRT18) and MHC-II molecules. To evaluate the gene signature scores, we used the Singscore R package (Foroutan et al., 2018; Bhuva et al., 2020). Wilcoxon rank-sum test was used for the statistical analysis.

