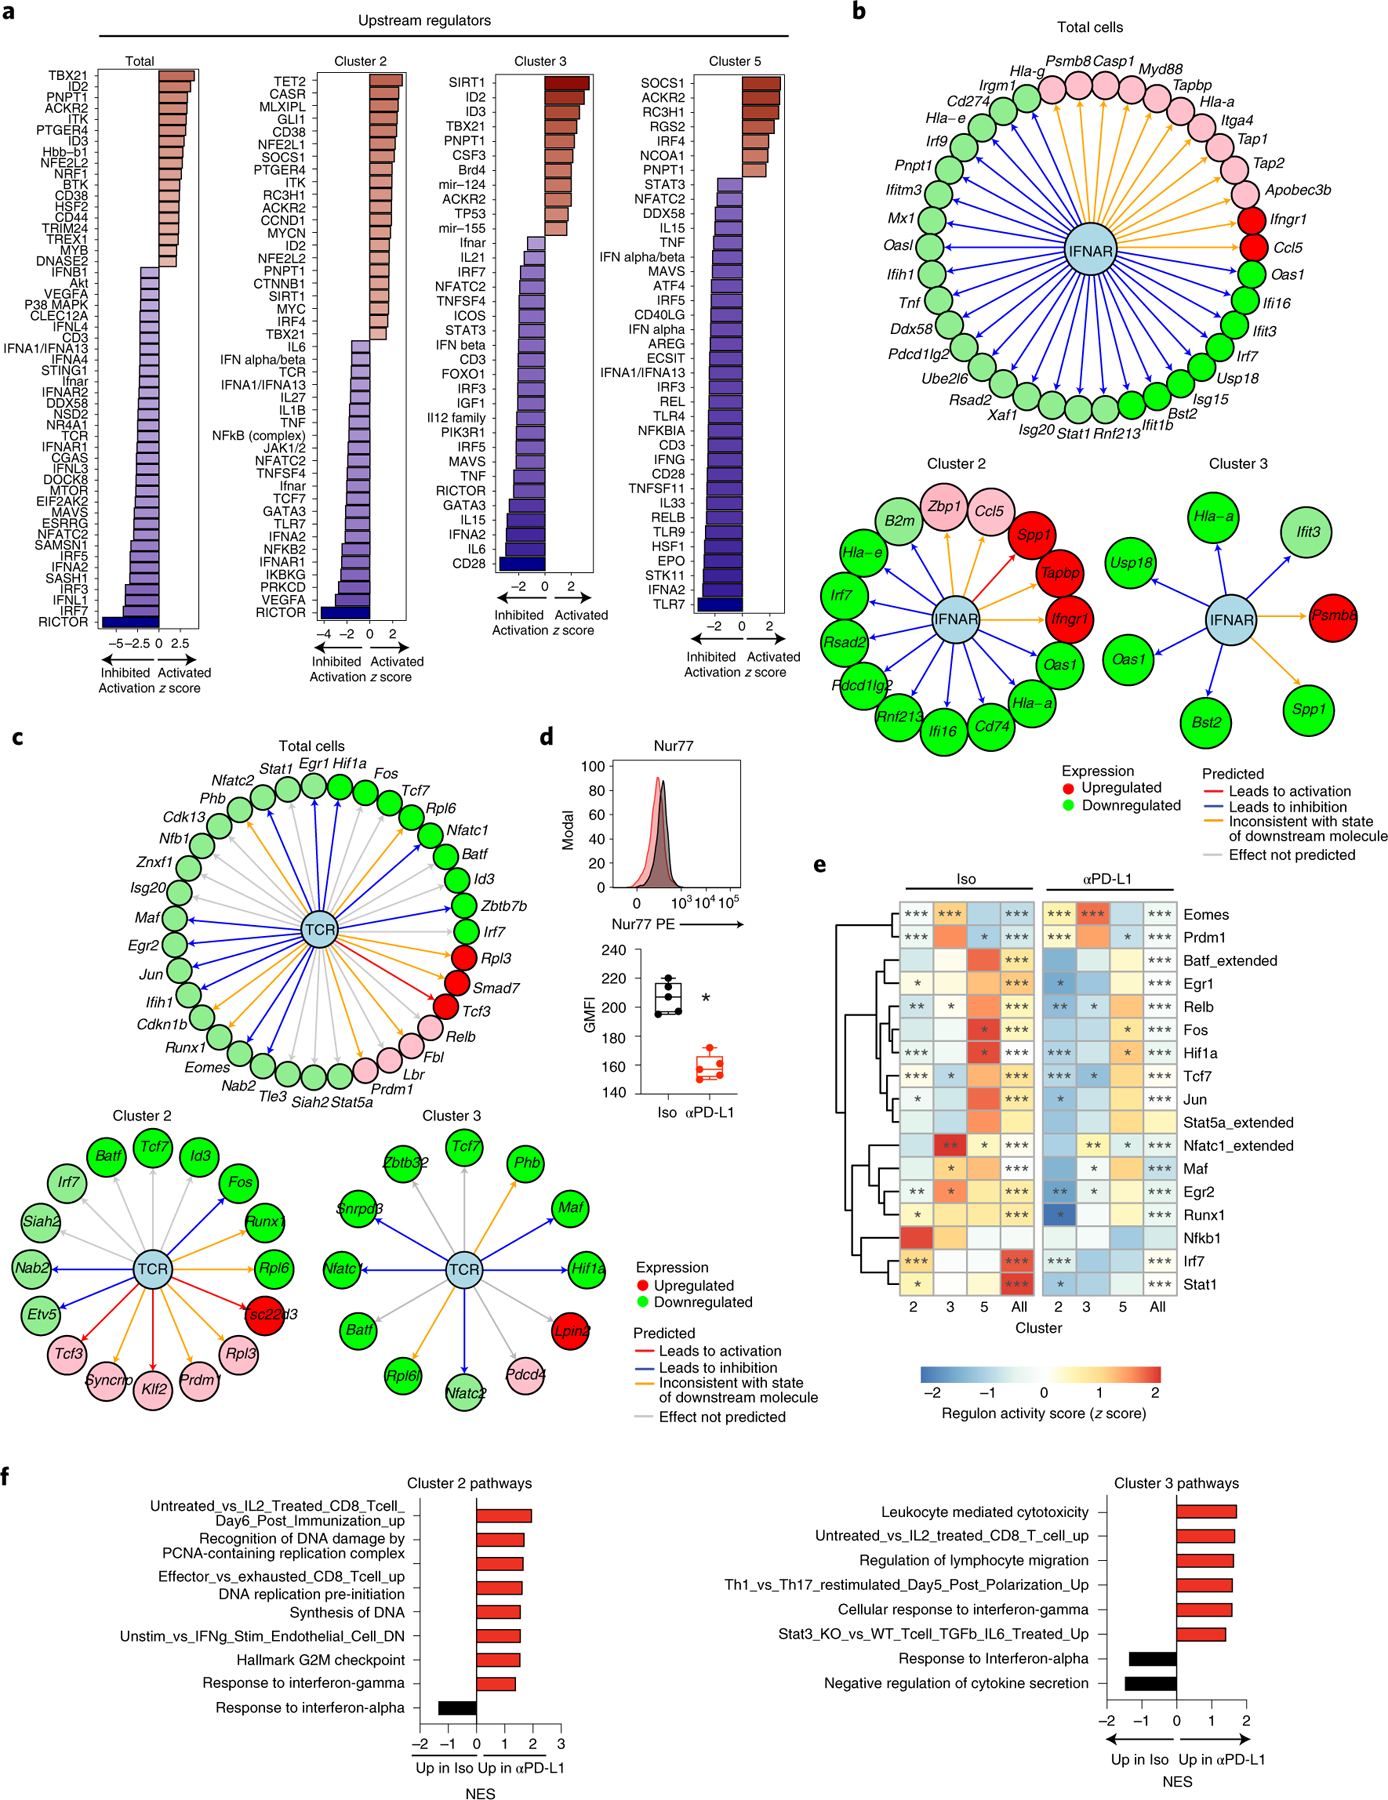
Fig. 6 |. PD-L1 blockade reorients intracellular interferon and TCR signaling.
a, Bar graphs depict activation z-scores of IPA-predicted upstream regulator molecules in total (that is, all clusters combined) SMARTA CD4+ T cells, and individually in clusters 2, 3 and 5. b,c, Changes in gene expression that define inhibition of the (b) interferon alpha/beta receptor (IFNAR) complex or (c) TCR signaling as an upstream regulator. Data is across total SMARTA cells, c2 and c3 cells comparing anti-PD-L1 with isotype treatment. Green and red coloring of genes depicts downregulation or upregulation of gene expression, respectively. Red and blue lines indicate a decrease would lead to observed gene activation or inhibition, respectively. Orange lines signify that predicted gene expression change is inconsistent with the state of the downstream molecule, and a gray line signifies that the effect cannot be predicted. d, Flow cytometric analysis of Nur77 protein expression in SMARTA cells following the third isotype or anti-PD-L1 treatment. e, Rows in the heatmap illustrate the z-score of the RAS average (representing the activity of the regulons associated with the indicated transcription factor) and the number of downstream target genes (g) coexpressed with each transcription factor. P values (Wilcoxon test) comparing RAS means in anti-PD-L1 versus isotype-treated cells for each regulon and Seurat cluster corrected for the false discovery rate (FDR) for multiple hypothesis testing. ***FDR < 0.001, **FDR < 0.01, *FDR < 0.05 indicate a significant difference in the indicated regulon between anti-PD-L1 and isotype treatment. f, Gene set enrichment analysis of differentially expressed pathways in TH1 clusters 2 and 3 in CD4+ SMARTA T cells from anti-PD-L1 treated (red) or isotype-treated (black) mice. Pathways are ranked by normalized enrichment score (NES) and have P values <0.05. a–c,e,f, Data are representative of a single scRNA-seq experiment comprised of pooled cells from isotype (n = 4 mice pooled) and anti-PD-L1 (n = 4 mice pooled). d, Box plots show n = 5 isotype and n = 5 anti-PD-L1 and the experiment is representative of n = 9 isotype and n = 10 anti-PD-L1 mice examined over two experiments. *P < 0.05; unpaired, two-tailed Student’s t-test (d). Box plots indicate the median, upper and lower quartiles, and the whiskers show the high and low values.

