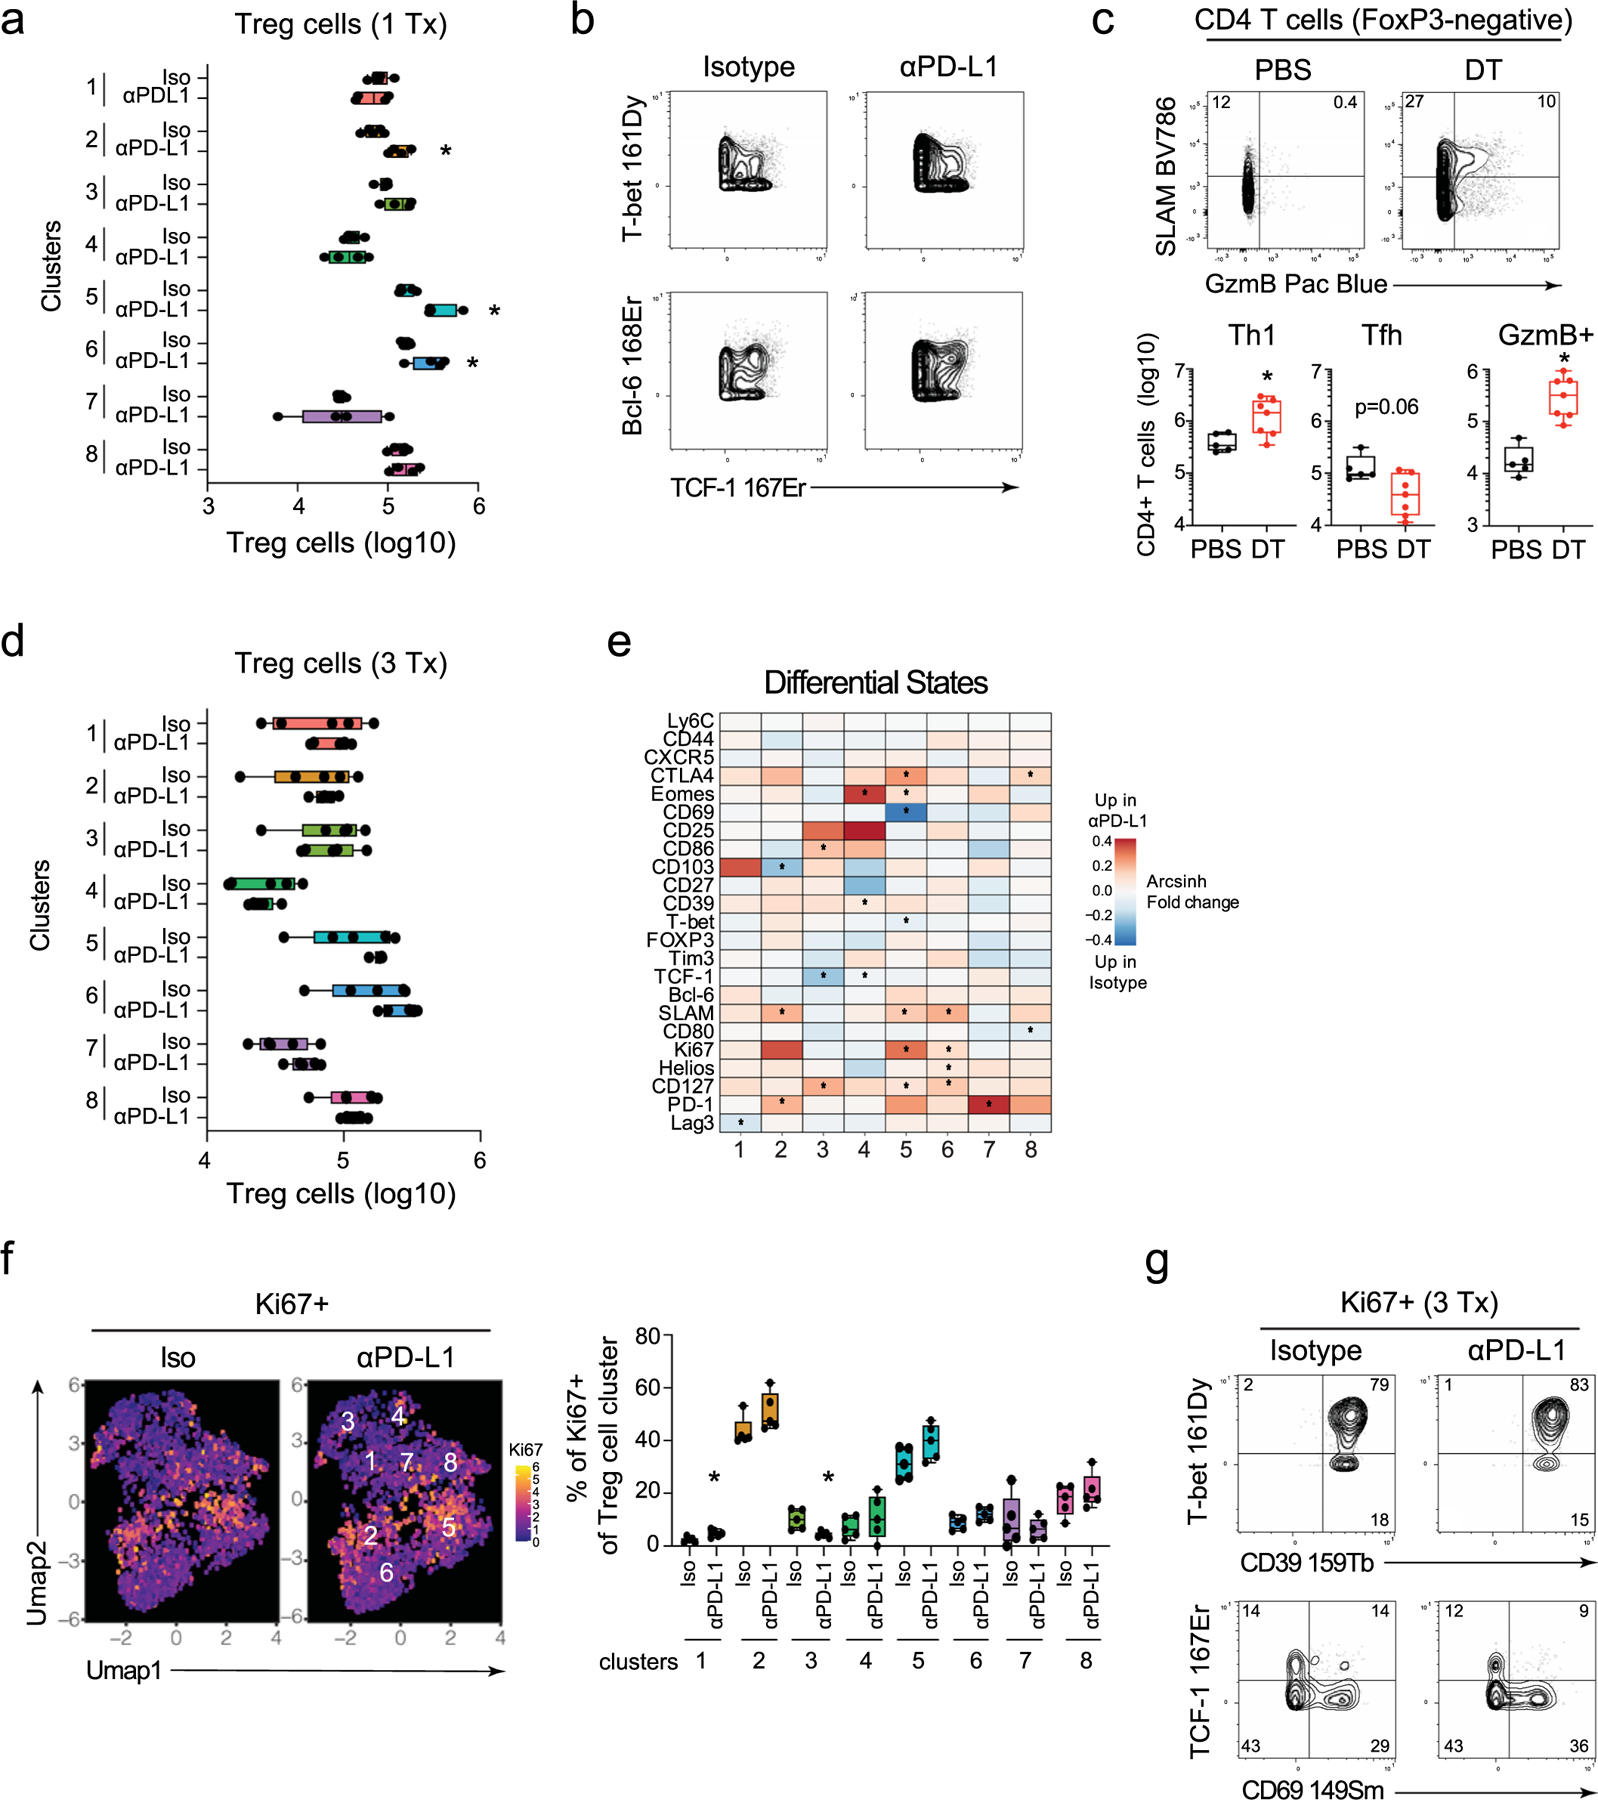
Extended Data Fig. 4 |. PD-L1 blockade targets cycling, TH1-phenotype Treg cells.
(a) Total number of Foxp3+ Treg cells in each cluster at 60 h after the first isotype or anti-PD-L1 treatment. (b) Representative 2D CyTOF plots of T-bet, Bcl-6 and TCF-1 expression in total Treg cells. (c) To deplete Treg cells, LCMV-Cl13 infected Foxp3DTR mice were treated with DT or as a control PBS on days 23, day 24, day 27 and day 30 after infection. Mice were sacrificed at day 33 and splenocytes isolated for flow cytometric analysis. Representative FACS plots depict SLAM vs GzmB expression in splenic Foxp3-negative effector CD4+ T cells. Box plots depict total numbers of TH1, TFH and GzmB+ Foxp3-negative CD4+ T cells. (d) Total number of Foxp3+ Treg cells in each cluster following 3 treatments. (e) The colors in the heatmap designate the arcsinh ratio of the MSI change for the indicated protein within each PhenoGraph cluster of Treg cells. The graph is comparing protein expression in Foxp3+ Treg cells following the third anti-PD-L1 versus isotype treatment, with (red) increased with anti-PD-L1 treated mice or (blue) increased in isotype-treated mice. P-values are calculated by the limma test in the diffcyt R package. *, p-value<0.05. (f) UMAPs and bar graph depict the expression and proportion of Ki67+ cells in each Treg PhenoGraph cluster following 3 anti-PD-L1 or isotype treatments. (g) Representative protein expression plots gated on Ki67+ Treg cells in spleens of mice following 3 anti-PD-L1 or isotype treatments. (a) n = 5 mice in the isotype group and n = 4 in the anti-PDL1 group. The experiment is representative of n = 18 isotype and n = 16 anti-PDL1 mice examined over three experiments. (c) n = 5 mice in the PBS group and n = 7 mice in the DT group. The experiment is representative of n = 8 mice in the isotype and n = 11 mice in the DT group examined over two experiments. (d–g) n = 5 mice per group.The experiment is representative of n = 15 mice per group examined over three experiments. *: p < 0.05; (unpaired, two-tailed Student’s t-test (a, c, d, f). Box plots indicate the median, upper and lower quartile, and the whiskers show the high and low value.

