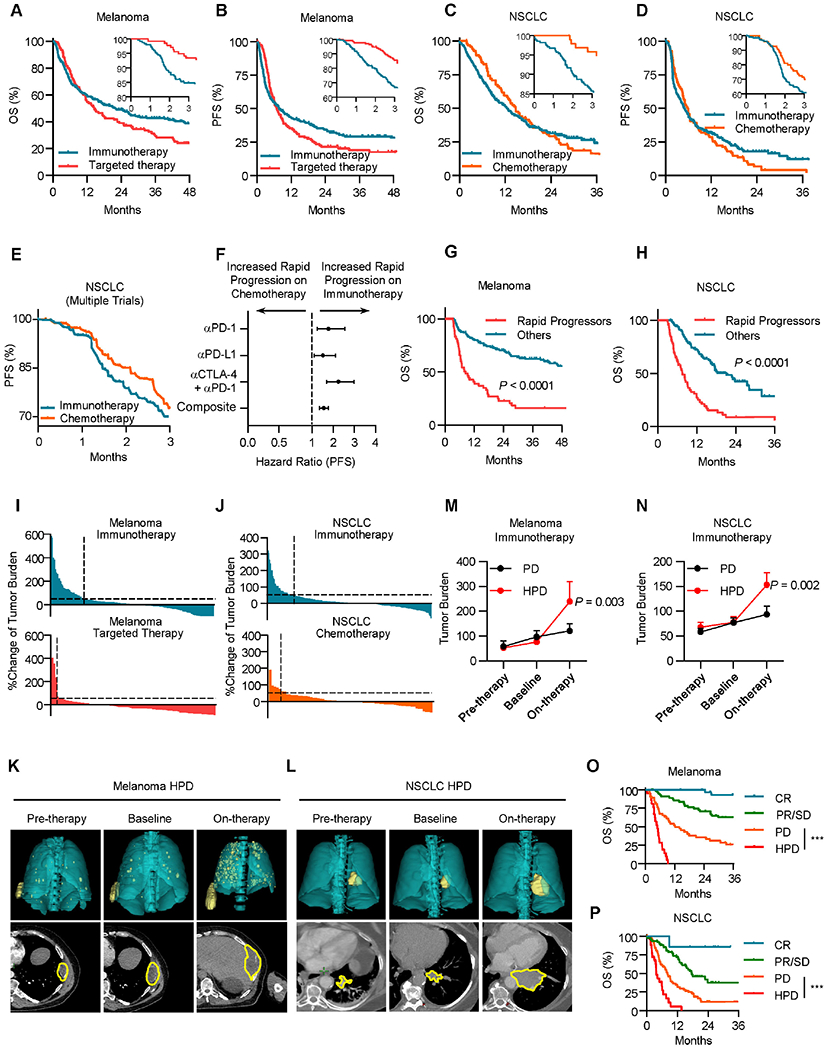
Figure 1: Rapid cancer progression occurs in a subset of patients during immunotherapy.

A, Overall survival (OS) of patients with metastatic melanoma (Cohort 1) stratified by therapy type; inset, 3-month OS; immunotherapy n = 251, targeted therapy n = 138, Restricted mean survival time (RMST) at 3 months, Hazard ratio (HR) = 0.95, P < 0.0001 by log-rank test.
B, Progression-free survival (PFS) of patients with metastatic melanoma stratified by therapy type. Inset, 3-month PFS. Progression-free RMST at 3 months HR = 0.89, immunotherapy n = 251, targeted therapy n = 138, P < 0.0001 by log-rank test.
C, OS of patients with metastatic NSCLC stratified by therapy type; Inset, 3-month OS; immunotherapy n = 279, chemotherapy n = 96, RMST at 3 months, HR = 0.94, P < 0.0001 by log-rank test.
D, PFS of patients with metastatic NSCLC stratified by therapy type. Inset, 3-month PFS; immunotherapy n = 279, chemotherapy n = 96, Progression-free RMST at 3 months, HR = 0.94, P < 0.0001 by log-rank test.
E, PFS of metastatic NSCLC patients treated with immunotherapy or chemotherapy, pooled analysis of Keynote-042, Poplar, and Checkmate 227 randomized control trials. Progression-free Log-rank HR at 3 months = 0.616, P = 0.0336.
F, Hazard ratios for 3-month PFS of metastatic NSCLC patients treated with immunotherapy or chemotherapy, pooled analysis of Keynote-042, Poplar, and Checkmate 227 randomized control trials. Two-sided t test, P = 0.0152.
G, OS of patients with metastatic melanoma treated with ICB (Cohort 1) stratified by timing of progression, other n = 146, rapid progression (PFS < 3 months) n = 53, Landmark analysis (3 months) hazard ratio (HR) = 0.291, P < 0.0001 by log-rank test.
H, OS of patients with metastatic NSCLC treated with ICB (Cohort 2) stratified by timing of progression, other n = 113, rapid progression (PFS < 3 months) n = 67, Landmark analysis (3 months) hazard ratio (HR) = 0.3251, P < 0.0001 by log-rank test.
I, Waterfall plot showing change of tumoral burden from initiation of therapy to first surveillance imaging in melanoma patients treated with indicated therapy, dotted line > 50% increase in tumor burden, immunotherapy n = 200, targeted therapy n = 96, Chi-square = 19.53, P < 0.0001. Data are shown as percentage change.
J, Waterfall plot showing change of tumoral burden from initiation of therapy to first surveillance imaging in NSCLC patients treated with indicated therapy, dotted line > 50% increase in tumor burden, immunotherapy n = 212, chemotherapy n = 68, Chi-square = 5.133, P = 0.0235. Data are shown as percentage change.
K-L, Representative cross-sectional (lower) and 3D reconstructed (upper) computed tomography (CT) images of a patient with metastatic melanoma (K) and a patient with NSCLC (L) with HPD preceding receipt of immunotherapy (left), at baseline preceding immunotherapy (middle), and at first reassessment following immunotherapy (right).
M-N, Longitudinal tumor burden assessment in melanoma (M) or NSCLC (N) patients who progressed while receiving ICB stratified by pattern of response. Baseline- cross sectional imaging immediately prior to ICB initiation. Pre-therapy- Imaging assessment prior to baseline evaluation. On therapy- next surveillance scan after baseline assessment. Melanoma patients with PD (progressive disease, per RECIST 1.1, n = 48) and HPD (hyperprogressive disease, per Champiat et al., n = 21); NSCLC patients with PD (n = 77) and HPD (n = 26), interrupted time series regression, Data are shown as mean ± s.d., P value indicated.
O. OS of metastatic melanoma patients (Cohort 1) stratified by best response, complete response (CR) n = 31, partial/stable disease (PR/SD) n = 58, progressive disease (PD) n = 48, and hyperprogressive disease (HPD) n = 21. Log-rank test, HPD vs PD HR = 0.3058, ***P < 0.001.
P. OS of metastatic NSCLC patients (Cohort 2) stratified by best response, CR n = 7, PR/SD n = 77, PD n = 77, and HPD n = 26. Log-rank test, HPD vs PD HR = 0.25, ***P < 0.001.
