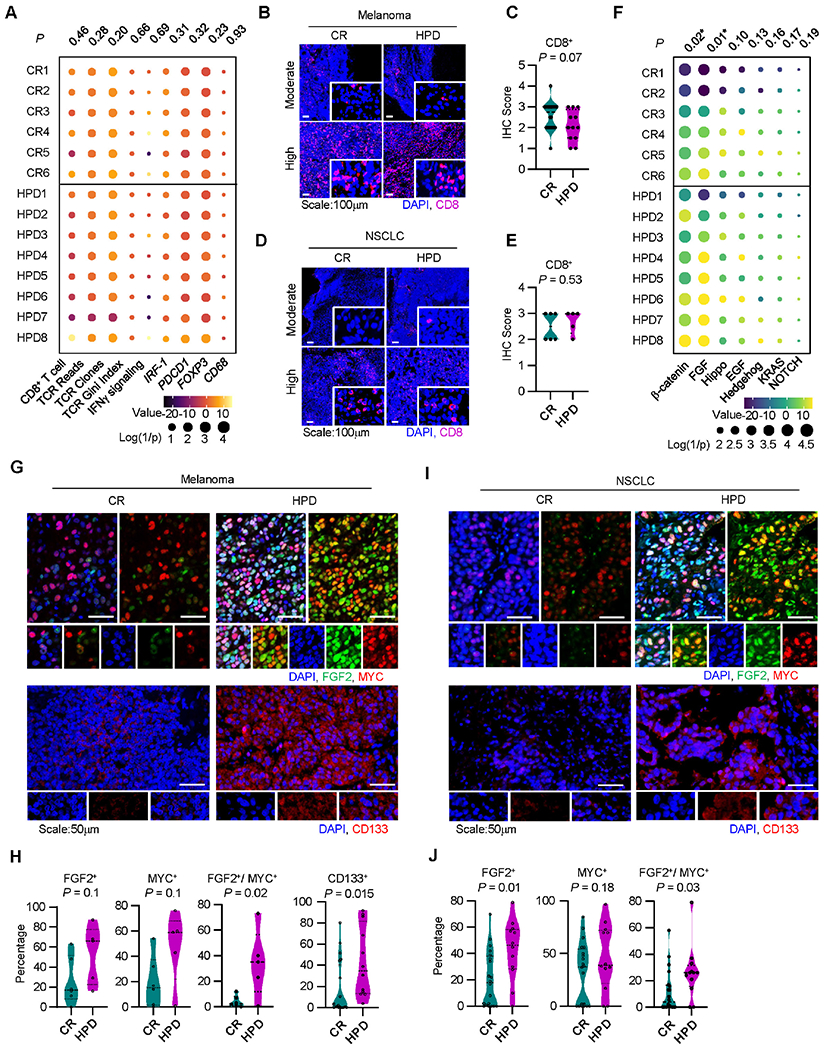
Figure 2: Immunogenic and oncogenic pathways correlate in patients with HPD.

A. Immune gene signature analysis of patients receiving immunotherapy who developed a complete response (CR) or hyperprogressive disease (HPD) per Champiat et al. in Cohort 3, individual patients are shown; P-values were generated from multivariate mixed effect linear models controlling for biopsy site (fixed effect) and disease type (random effect).
B-C. Representative immunofluorescence staining (B) and quantitation (C) for baseline tumor infiltrating CD8+ T cells in melanoma patients with indicated response to therapy. Frequency of positive cells is shown; CR, n = 20, HPD, n =12. Two-sided t-test.
D-E. Representative immunofluorescence staining (D) and quantitation (E) for baseline tumor infiltrating CD8+ T cells in NSCLC patients with indicated response to therapy. Frequency of positive cells is shown; CR, n = 20, HPD, n =12. Two-sided t-test.
F. Oncogenic gene signature analysis of patients receiving immunotherapy who developed a complete response (CR) or hyperprogressive disease (HPD) in Cohort 3, individual patients are shown; P-values were generated from multivariate mixed effect linear models controlling for biopsy site (fixed effect) and disease type (random effect).
G-J. Multiplex immunofluorescence staining was conducted in tumor tissues from patients with melanoma (G, H) and NSCLC (I, J). Representative images showed FGF2, MYC, and CD133 expressing tumor cells in patients with HPD and CR (G, I). Percentages of single or double positive tumor cells are shown in patients with HPD and CR (H, J). Mean and interquartile range shown. Melanoma patients with CR (n = 20) and HPD (n =12); NSCLC patients with HPD (n = 5) and CR (n = 6). Two-sided t-test.
