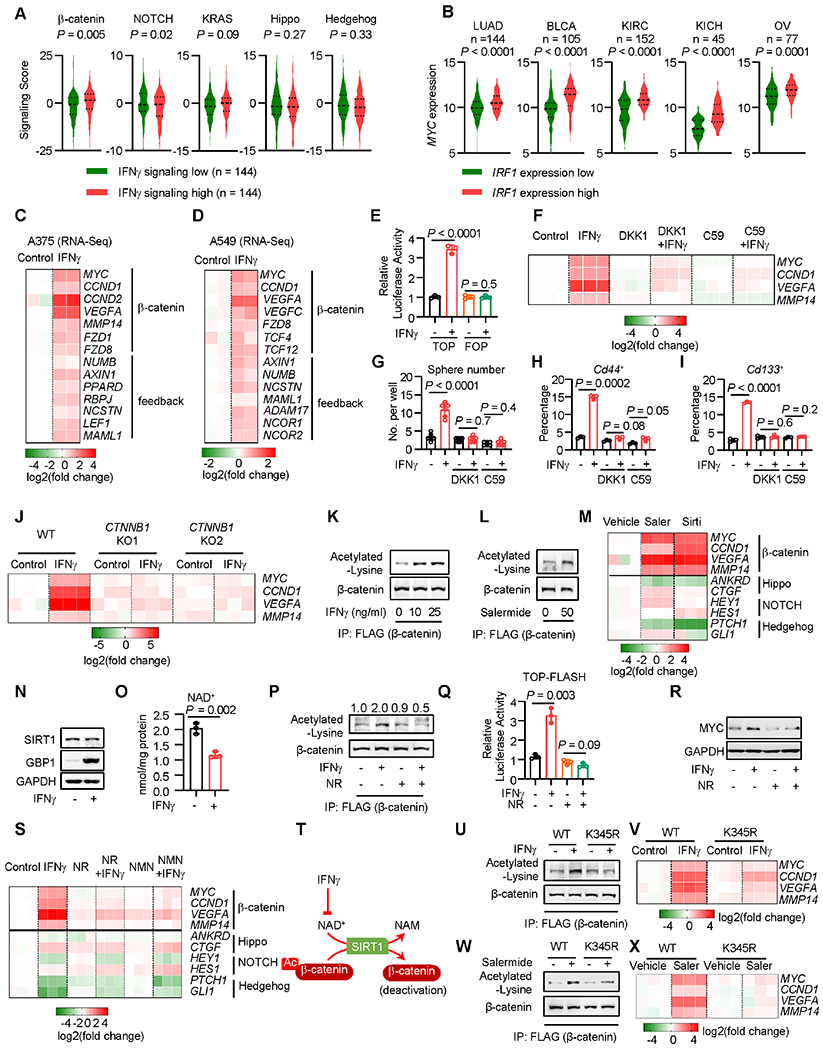
Figure 4: IFNγ reduces NAD+ to activate β-catenin acetylation.

A. Correlation between the IFNγ and oncogenic signaling gene scores in lung adenocarcinoma in TCGA datasets. The expression of the indicated oncogenic gene signaling scores was plotted based on the top and bottom 25th percentiles of the IFNγ gene signaling scores. P value by two-tailed t-test.
B. Correlation between the IRF1 and MYC signaling gene scores in several cancer types in TCGA datasets. The expression of the MYC gene signaling scores was plotted based on the top and bottom 25th percentiles of the IRF1 gene signaling scores. P value by two-tailed t-test. LUAD, lung adenocarcinoma; BLCA, Bladder urothelial carcinoma; KIRC, Kidney renal clear cell carcinoma; OV, ovarian cancer.
C-D. Based on the RNA-seq datasets (GSE99299), the indicated gene expression was shown in A375 (C) or A549 (D) cells in the presence or absence of IFNγ. n = 2.
E. A375 cells were transfected with β-catenin signaling reporter TOP-FLASH or the mutant vector (FOP-FLASH). Cells were treated with IFNγfor 48 hours. Results are expressed as the relative luciferase activity. Data are shown as mean ± s.d., n = 3, P value by two-tailed t-test.
F. A375 cells were treated with IFNγ and recombinant DKK1 or Wnt-C59 (C59) for 48 hours. The indicated gene expression was determined by qPCR. n = 3.
G. YUMM1.7 cells were treated with IFNγ and DKK1 or Wnt-C59 (C59) for 48 hours, followed by 3D-sphere culture. Spheres were counted on day 7 after sphere culture. Data are shown as mean ± s.d., n = 6. Two-tailed t-test.
H-I. YUMM1.7 cells were treated with IFNγ and DKK1 or Wnt-C59 (C59) for 48 hours. Percentages of Cd44+ (H) or Cd133+ (I) cells were determined by FACS. Data are shown as mean ± s.d., n = 3. Two-tailed t-test.
J. Wild type or 2 clones of CTNNB1 KO A375 cells were treated with IFNγ for 48 hours. The indicated gene expression was determined by qPCR. n = 3.
K. Flag-tagged β-catenin expressing A375 cells were treated with IFNγ for 24 hours. Co-IP was performed with Flag antibody. Acetylated-lysine and β-catenin were detected in the IP products. 1 of 2 Western blots shown.
L. Flag-tagged β-catenin expressing A375 cells were treated with Salermide for 10 hours. Acetylated-lysine and β-catenin were determined in the Co-IP products with Flag antibody. 1 of 2 blots shown.
M. A375 cells were treated with Salermide (Saler) or Sirtinol (Sirti) for 24 hours. The indicated gene expression was determined by qRT-PCR. n = 3.
N. A375 cells were treated with IFNγ for 24 hours. SIRT1 and GBP1 (positive control) proteins were detected by Western blot. 1 of 2 Western blots shown.
O. A375 cells were treated with IFNγ for 24 hours. NAD+ levels were determined by quantitation kit. Data are shown as mean ± s.d., n = 3. Two-tailed t-test.
P. Flag-tagged β-catenin expressing A375 cells were treated with IFNγ, in the presence or absence of 0.7 mM nicotinamide riboside (NR), for 24 hours. Acetylated-lysine and β-catenin were detected in the Co-IP products with Flag antibody. 1 of 2 Western blots shown.
Q. A375 cells carrying TOP-FLASH were treated with IFNγ, in the presence or absence of 0.7 mM nicotinamide riboside (NR), for 24 hours. Luciferase activity of the β-catenin signaling reporter was determined. Data are shown as mean ± s.d., n = 3. Two-tailed t-test.
R. A375 cells were treated with IFNγ and nicotinamide riboside (NR) for 24 hours. MYC and GAPDH proteins were determined by Western blot. 1 of 3 Western blots shown.
S. A375 cells were treated with IFNγ and nicotinamide riboside (NR) or β-nicotinamide mononucleotide (NMN) for 48 hours. The indicated gene expression was determined by qPCR. n = 3.
T. Schematic diagram showing that IFNγ reduces NAD+ to suppress SIRT1-mediated β-catenin deacetylation, thereby activating β-catenin.
U-V. Wild type or CTNNB1 K345R mutant A375 cells were treated with IFNγ. 24 hours after treatment, acetylated β-catenin was determined by Western blotting following Flaĝ-catenin Co-IP (U). 48 hours after treatment, the indicated gene expression was determined by qPCR (V). 1 of 2 Western blots shown, n = 3 for qPCR.
W-X. Wild type or CTNNB1 K345R mutant A375 cells were treated with Salermide (Saler). 12 hours after treatment, acetylated β-catenin was determined by Western blotting following Flag-β- catenin Co-IP (W). 24 hours after treatment, the indicated gene expression was determined by qPCR (X). 1 of 2 Western blots shown, n = 3 for qPCR.
See also Figure S4.
