
Figure 5: IFNγ regulates PKM2 phosphorylation to alter NAD+/ β-catenin signaling.
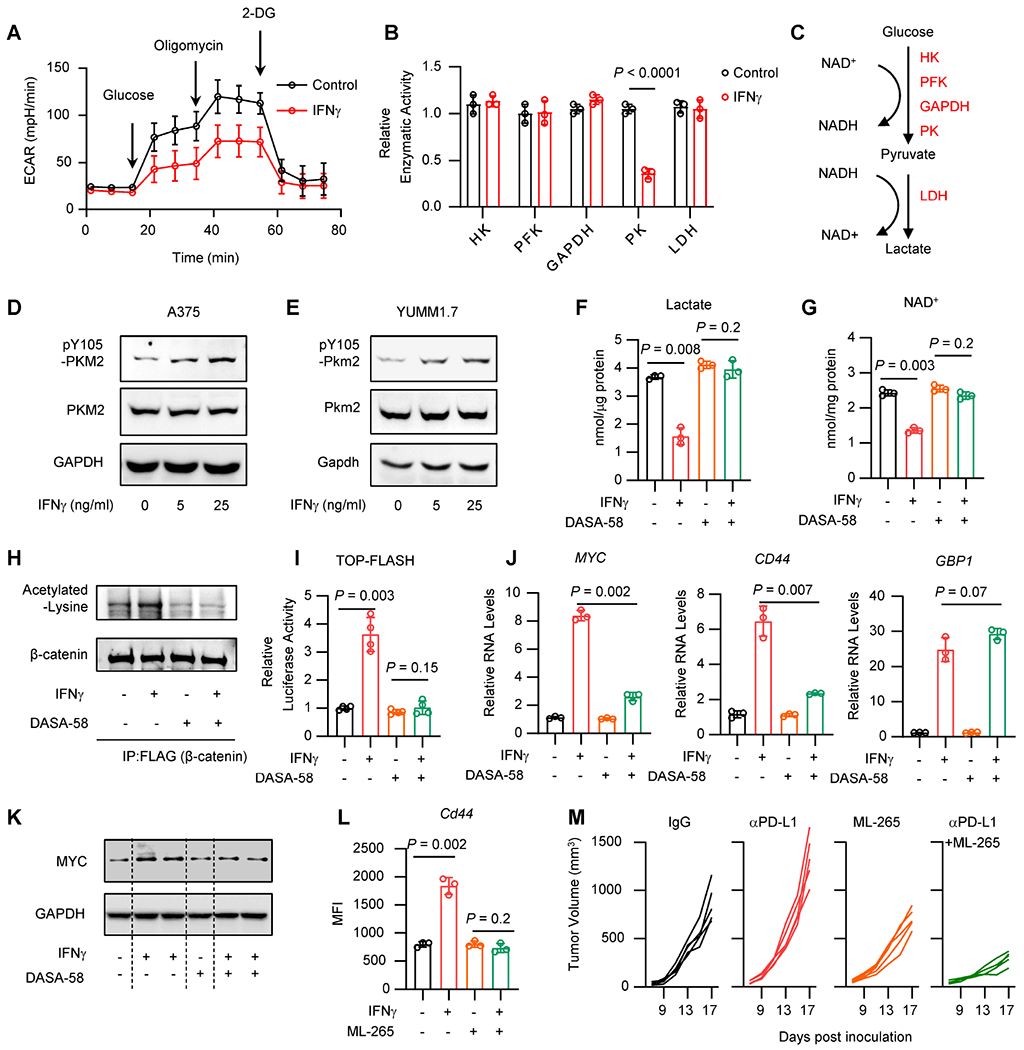
A. A375 cells were treated with IFNγ for 24 hours. Seahorse analysis showed the extracellular acidification rate (ECAR) in control cells and IFNγ-treated cells in the presence of glucose, oligomycin or 2-DG. Data are shown as mean ± s.d., n = 3.
B. A375 cells were treated with IFNγ for 24 hours. Catalytic activities of glycolysis rate-limiting enzymes were determined by quantitation kits. Data are shown as mean ± s.d., n = 3. Two-tailed t-test.
C. Schematic diagram showing the glycolysis pathway and the NAD+/ NADH balance.
D-E. A375 (D) or YUMM1.7 (E) cells were treated with IFNγ for 24 hours. Phosphorylated or total protein levels of PKM2 were detected by Western blot. 1 of 2 Western blots shown.
F-G. A375 cells were treated with IFNγ, in the presence or absence of DASA-58, for 48 hours. Lactate production (F) or intracellular levels of NAD+ (G) were determined by quantitation kit. Data are shown as mean ± s.d., n = 3. Two-tailed t-test.
H. A375 cells carrying Flag-tagged β-catenin were treated with IFNγ, in the presence or absence of DASA-58. Acetylated-lysine and β-catenin were detected in the Co-IP products with Flag antibody. 1 of 2 Western blots shown.
I. A375 cells carrying TOP-FLASH were treated with IFNγ, in the presence or absence of DASA-58, for 24 hours. Relative luciferase activity was determined. Data are shown as mean ± s.d., n = 4. Two-tailed t-test.
J. A375 cells were treated with IFNγ, in the presence or absence of DASA-58, for 24 hours, β- catenin signaling genes and IFNγ signaling gene (GBP1) (positive control) were determined by qRT-PCR. Data are shown as mean ± s.d., n = 3. Two-tailed t-test.
K. A375 cells were treated with IFNγ, in the presence or absence of DASA-58, for 48 hours. MYC and GAPDFI proteins were determined by Western blot. 1 of 2 Western blots shown.
L. YUMM1.7 cells were treated with IFNγ, in the presence or absence of ML-265, for 48 hours. Surface expression of Cd44 was determined by FACS. Data are shown as mean ± s.d., n = 3. Two-tailed t-test.
M. YUMM1.7 tumor bearing C57BL/6 mice were treated with anti-PD-L1, ML-265, or the combination of anti-PD-L1 and ML-265. Tumor growth curves were plotted, n = 5 / group.
See also Figure S5.