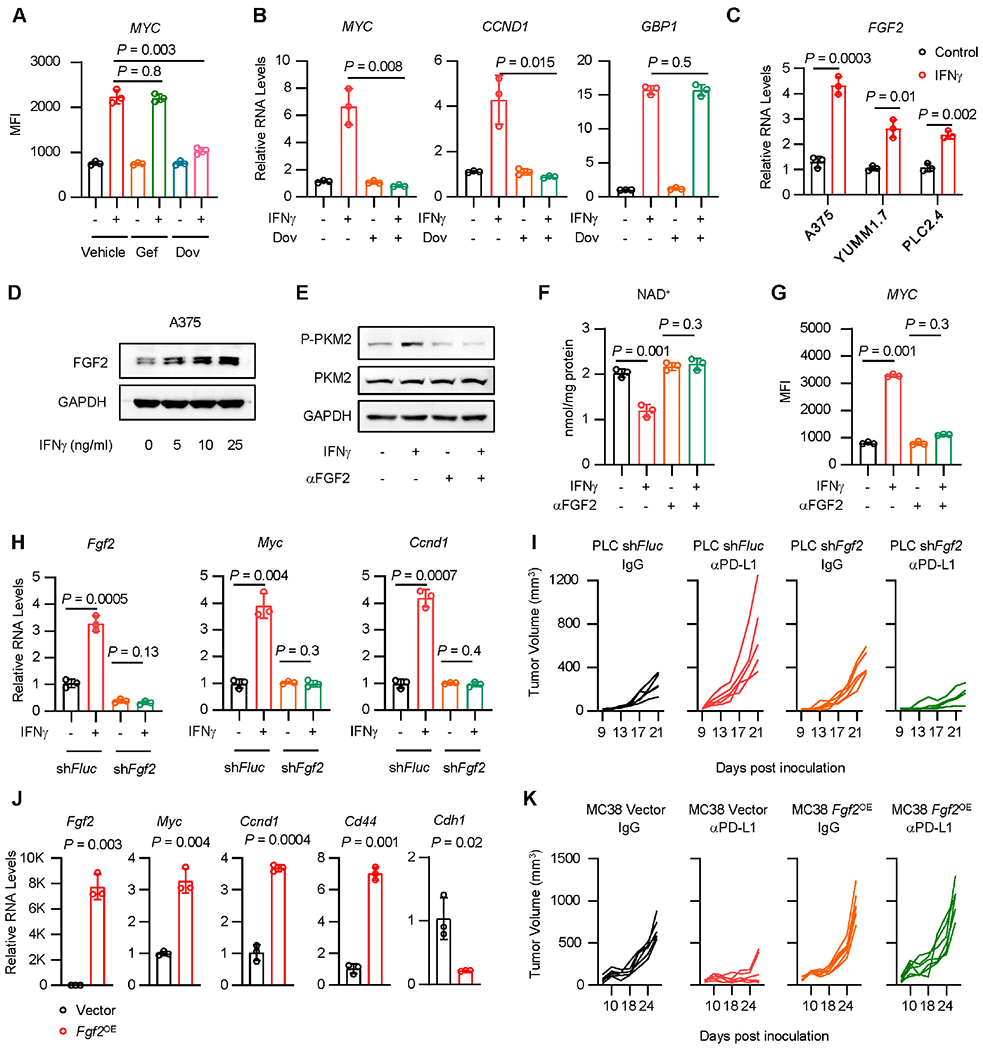
Figure 6: IFNγ induces FGF2 to control PKM2/ NAD+/ β-catenin signaling.

A. A375 cells were treated with IFNγ in the presence of Gefitinib (Gef) or Dovitinib (Dov), for 36 hours. MYC protein was determined by FACS. Data are shown as mean ± s.d., n = 3. Two-tailed t- test.
B. A375 cells were treated with IFNγ in the presence of Dovitinib (Dov), for 48 hours, β-catenin signaling genes (MYC, CCND1) and IFNγ signaling gene (GBP1) were determined by qRT-PCR. Data are shown as mean ± s.d., n = 3. Two-tailed t-test.
C. FGF2 transcripts were quantified by qRT-PCR in IFNγ-treated A375, YUMM1.7 and PLC2.4 cells. Data are shown as mean ± s.d., n = 3. Two-tailed t-test.
D. FGF2 protein was determined by Western blot in A375 cells treated with IFNγ. 1 of 2 Western blots shown.
E-G. A375 cells were treated with IFNγ, in the presence or absence of FGF2 neutralizing antibody (αFGF2). Phosphorylated (Y105) and total protein levels of PKM2 were determined at 24 hours by Western blot (E). Cellular NAD+ levels were quantified at 24 hours by kit (F). MYC expression was determined at 48 hours by FACS (G). 1 of 2 Western blots shown (E). Data are shown as mean ± s.d., n = 3. Two-tailed t-test (F, G).
H. Fgf2, Myc or Ccnd1 transcripts were detected by qRT-PCR in PLC2.4 shFlue or shFgf2 cells. Data are shown as mean ± s.d., n = 3. Two-tailed t-test.
I. shFluc or shFgf2 PLC2.4 tumor bearing C57BL/6 mice were treated with anti-PD-L1 and isotype IgG. Tumor growth curves were plotted, n = 5 animals.
J. MC38 cells were forced expression of Fgf2 (Fgf2OE). RNA levels of Fgf2, β-catenin signaling genes (Myc, Ccnd1, Cd44), and epithelial marker gene (Cdh1) were determined by qRT-PCR. Data are shown as mean ± s.d., n = 3. Two-tailed t-test.
K. Fgf2OE MC38 tumor bearing C57BL/6 mice were treated with anti-PD-L1 and isotype IgG. Tumor growth curves were plotted, n = 6 animals.
