FIGURE 5.

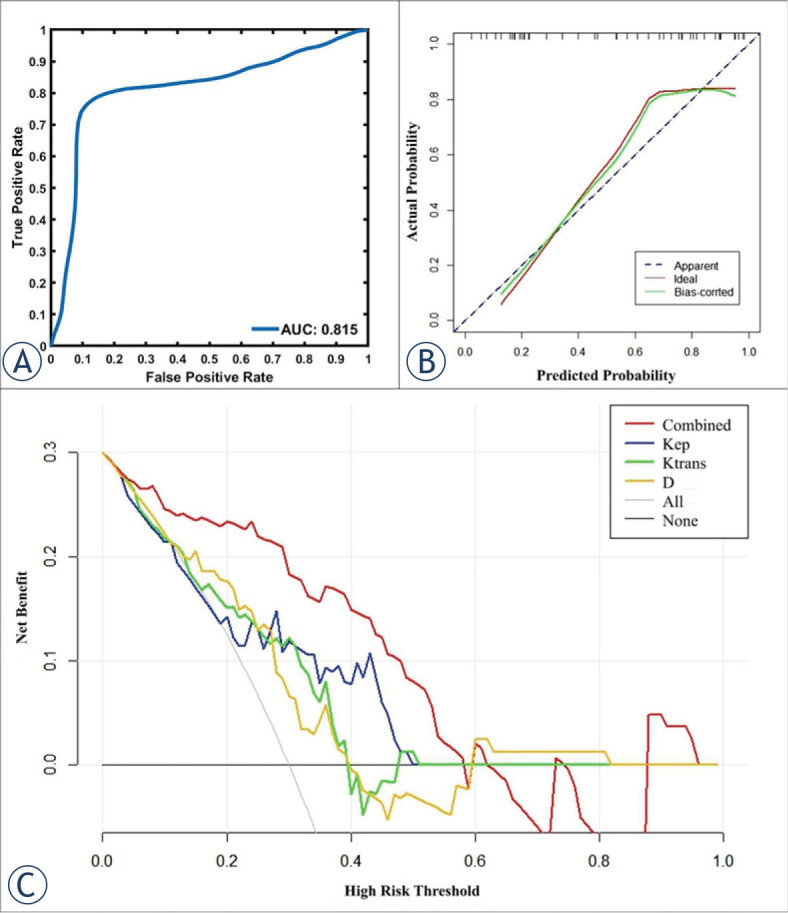
In the prediction of TP53 status, receiver operating characteristic curves (A), calibration curves (B), and decision curve analysis (C) of the validation model.

In the prediction of TP53 status, receiver operating characteristic curves (A), calibration curves (B), and decision curve analysis (C) of the validation model.