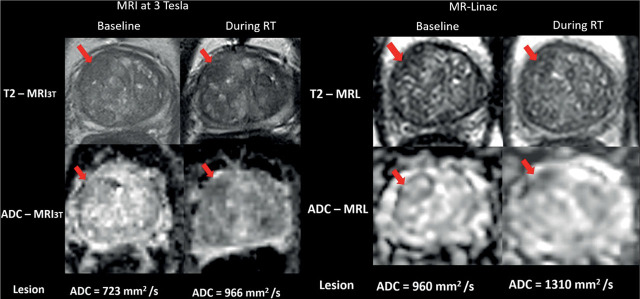
FIGURE 2.
T2-weighted MR images (scan time: 2 minutes) and apparent diffusion coefficient (ADC) maps of a 66-year-old male patient with prostate cancer in the antero-apical region of the transition zone (red arrows) at baseline (left column) and during radiotherapy (right column) as recorded on MR-Linac (MRL) and on standard MRI at 3T (MRI3T). The figure shows similar dynamics of lesion ADC elevation during radiotherapy.

