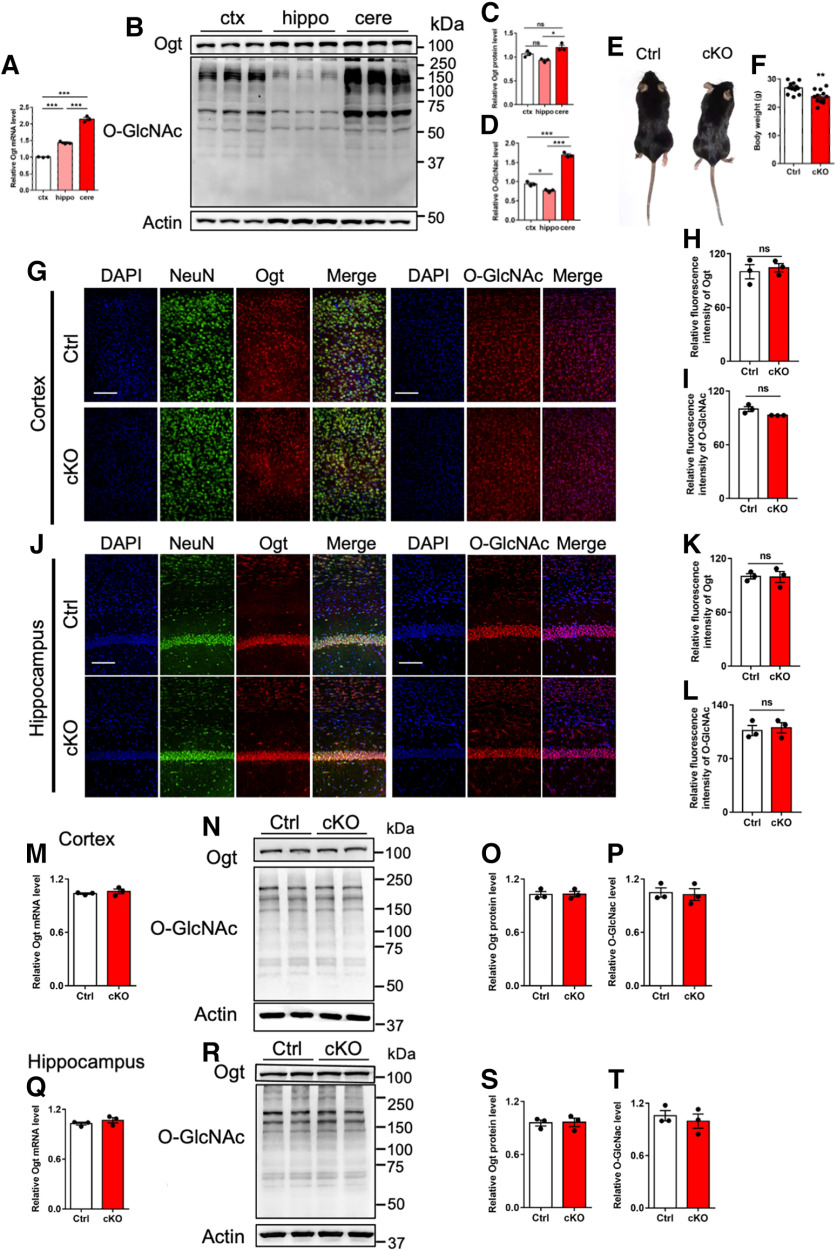
Figure 1.
Abundant O-GlcNAcylation in cerebellum and Math1-Cre::Ogtloxp/Y not affecting the levels of Ogt and O-GlcNAcylation in the cortex and hippocampus of adult mice. A, qRT-PCR assays of Ogt mRNA expression in cortex, hippocampus and cerebellum of eight-week-old (adult) mice, respectively. The primers used can be found in Table 1. B–D, Representative images of Western blot (WB) assays, and quantification of Ogt (C) and O-GlcNAcylation (D) levels in cortex, hippocampus and cerebellum of adult mice. n = 3 independent experiments for each group. Data are presented as mean ± SEM. One-way ANOVA analysis followed by Tukey's post hoc analysis, *p < 0.05, **p < 0.001, ***p < 0.0001. E, Gross appearance of adult Ctrl (Ogtloxp/Y) and cKO (Math1-Cre::Ogtloxp/Y) mice. F, Body weight of adult Ctrl and cKO mice. n = 12 mice per genotype. Data are presented as mean ± SEM. Unpaired Student's t test, *p < 0.05, **p < 0.001, ***p < 0.0001. G–I, Immunostaining (G) and quantification of the relative fluorescence intensity of Ogt (H) and O-GlcNAcylation (I) in the cortex of adult Ctrl and cKO mice. n = 3 mice for each group, and 3 sections from each animal. Data are presented as mean ± SEM. Unpaired Student's t test, *p < 0.05, **p < 0.001, ***p < 0.0001, ns, not significant. Scale bar, 100 μm. J–L, Immunostaining (J) and quantification of the relative fluorescence intensity of Ogt (K) and O-GlcNAcylation (L) in the hippocampus of adult Ctrl and cKO mice. n = 3 mice for each group, and 3 sections from each animal. Data are presented as mean ± SEM. Unpaired Student's t test, *p < 0.05, **p < 0.001, ***p < 0.0001, ns, not significant. Scale bar, 100 μm. M, qRT-PCR assay of Ogt mRNA expression in the cortex of adult Ctrl and cKO mice. n = 3 independent experiments for each group. Data are presented as mean ± SEM. Unpaired Student's t test, *p < 0.05, **p < 0.001, ***p < 0.0001. N–P, WB assay (N) and quantification results of Ogt (O) and O-GlcNAcylation (P) levels in the cortex of adult Ctrl and cKO mice. n = 3 independent experiments for each group. Data are presented as mean ± SEM. Unpaired Student's t test, *p < 0.05, **p < 0.001, ***p < 0.0001. Q, qRT-PCR assay of Ogt mRNA expression in the cortex of adult Ctrl and cKO mice. n = 3 independent experiments for each group. Data are presented as mean ± SEM. Unpaired Student's t test, *p < 0.05, **p < 0.001, ***p < 0.0001. R–T, WB assay (R) and quantification results of Ogt (S) and O-GlcNAcylation (T) levels in the cortex of adult Ctrl and cKO mice. n = 3 independent experiments for each group. Data are presented as mean ± SEM. Unpaired Student's t test, *p < 0.05, **p < 0.001, ***p < 0.0001.

