. 2023 Apr 11;307(4):e222786. doi: 10.1148/radiol.222786

Figure 2:

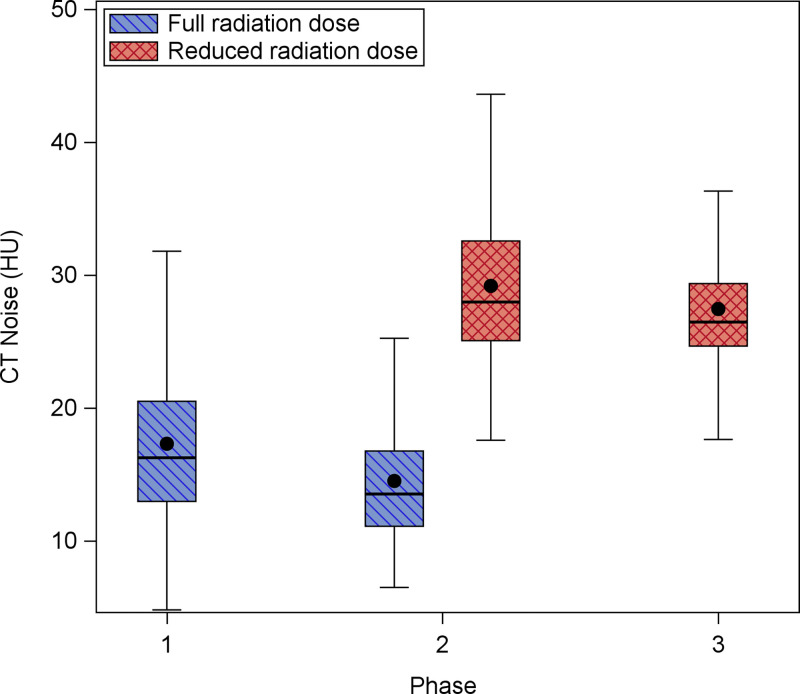
Box and whisker plot shows distribution of CT noise by phase and radiation dose. CT noise decreased slightly between baseline (phase 1) and 5-year follow-up (phase 2) but increased in the reduced-dose scans in phase 2 and 10-year follow-up (phase 3). Comparison of reduced-dose scans also shows that noise decreased from phase 2 to phase 3.

Box and whisker plot shows distribution of CT noise by phase and radiation dose. CT noise decreased slightly between baseline (phase 1) and 5-year follow-up (phase 2) but increased in the reduced-dose scans in phase 2 and 10-year follow-up (phase 3). Comparison of reduced-dose scans also shows that noise decreased from phase 2 to phase 3.