. 2023 Apr 11;307(4):e222786. doi: 10.1148/radiol.222786

Figure 3:

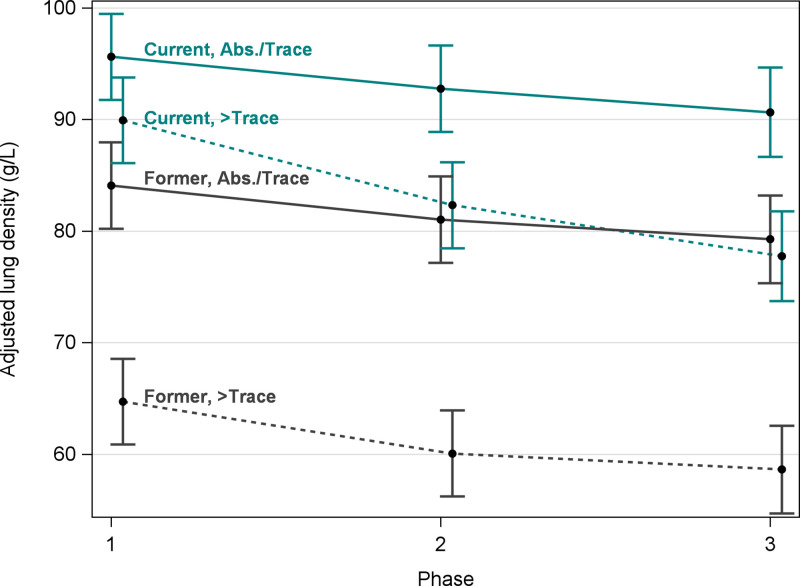
Graph shows mean and 95% CIs of volume-adjusted lung density (ALD) at each baseline (phase 1), 5-year follow-up (phase 2), and 10-year follow-up (phase 3) by smoking status and deep learning emphysema status at baseline. Means were estimated from a linear mixed model (model 2; see Statistical Analysis and Progression Models sections for details). Teal lines represent current smokers and dark gray lines represent former smokers. Solid lines represent absent (Abs.) or trace deep learning emphysema and dashed lines represent more than trace emphysema at baseline. Volume-ALD was higher in current smokers than in former smokers. Current and former smokers with absent or trace emphysema had only a slight decline in ALD during 10 years. Current smokers had the largest rate of decline in emphysema.

Graph shows mean and 95% CIs of volume-adjusted lung density (ALD) at each baseline (phase 1), 5-year follow-up (phase 2), and 10-year follow-up (phase 3) by smoking status and deep learning emphysema status at baseline. Means were estimated from a linear mixed model (model 2; see Statistical Analysis and Progression Models sections for details). Teal lines represent current smokers and dark gray lines represent former smokers. Solid lines represent absent (Abs.) or trace deep learning emphysema and dashed lines represent more than trace emphysema at baseline. Volume-ALD was higher in current smokers than in former smokers. Current and former smokers with absent or trace emphysema had only a slight decline in ALD during 10 years. Current smokers had the largest rate of decline in emphysema.