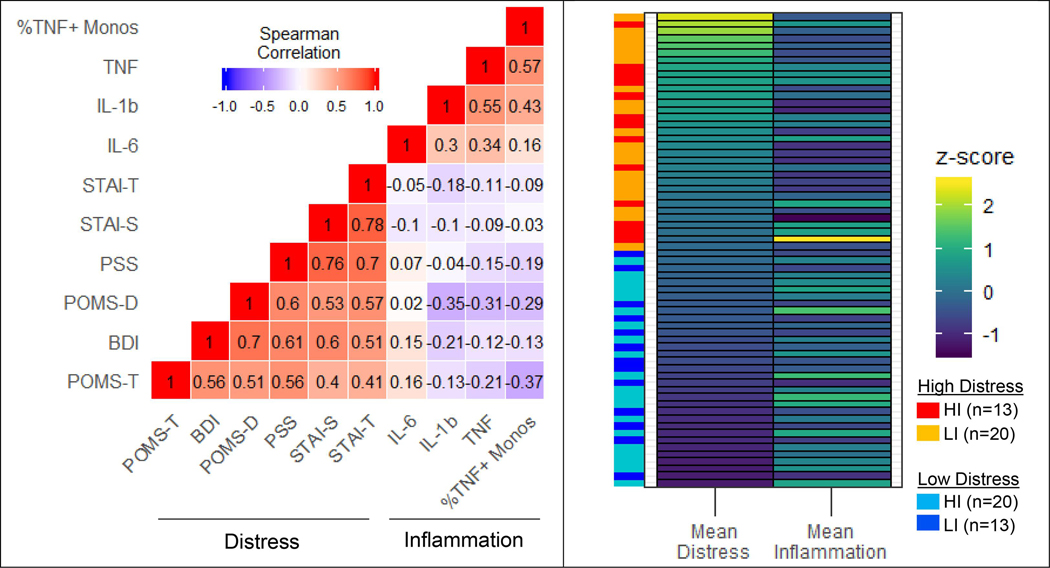
Fig. 1.
(left) Spearman correlation matrix. Values reflect Spearman’s rank correlation coefficients between standardized (z-score) scores on psychological distress measures and inflammatory biomarkers across all study participants. (right) Heat map illustrating subject-wise mean distress and inflammation z-scores. Each horizontal bar represents an individual subject. The vertical bars on the left indicates z-score-based groupings. Abbreviations: BDI = Beck Depression Inventory-II total score; STAI-S = State anxiety inventory total score; STAI-T = Trait anxiety inventory total score; POMS-D = Profile of Mood States depressive subscale; POMS-T = Profile of Mood States tension subscale; PSS = Perceived Distress Scale total score; TNF = plasma tumor necrosis factor alpha; IL-1b = plasma interleukin-1b; IL-6 = plasma interleukin-6; %TNF + Monos = %TNF+ monocytes 3.5hr post-lipopolysaccharide stimulation; HI = high inflammation; LI = low inflammation, based on median split of sample-wide inflammation z-scores.

