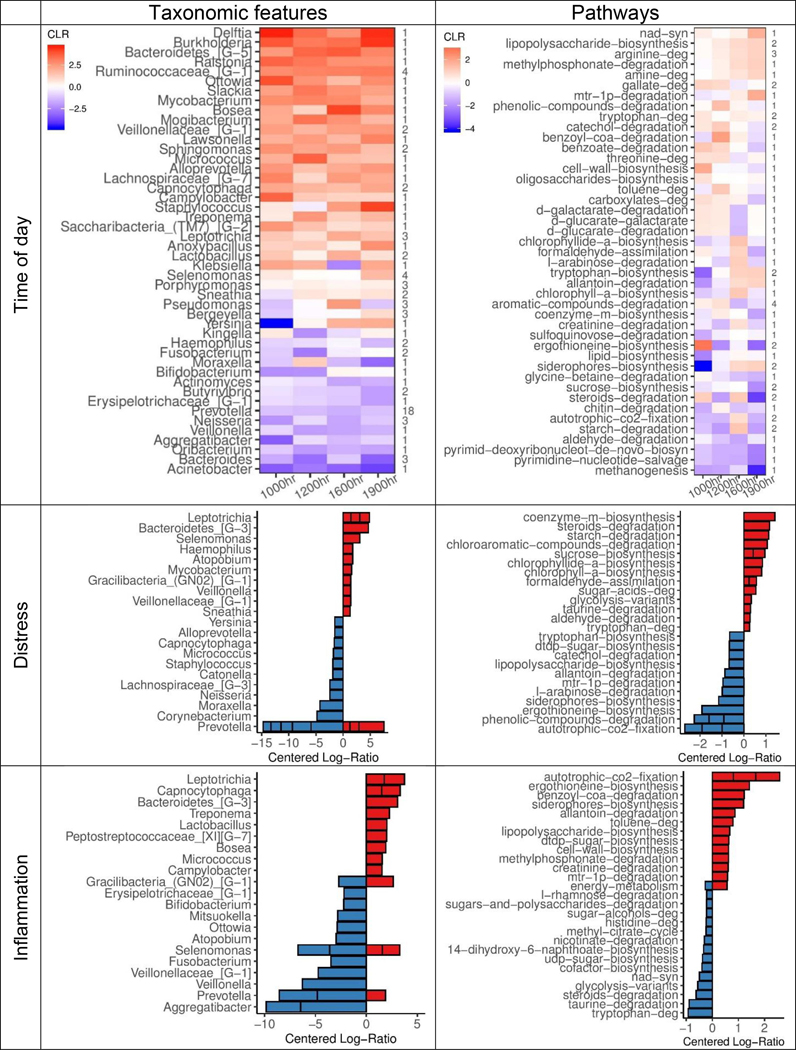
Fig. 2.
Centered log-ratios (CLR) of top-ranked taxonomic features (left) and metabolic pathways (right) derived from two multinomial regression models (e.g., one taxonomic feature-based model, one pathway-based model) of differentially ranked (DR) relative abundances. (Top row) Mean CLRs for all time-associated features (90 unique of 485 in feature set) and top- and bottom-ranked pathways (59 unique of 384 in feature set), averaged and grouped by genus or parent ontology, at each sampling time point relative to waking. Number of unique features per genus or pathway shown on right side of plot. (Middle and bottom rows) Mean CLRs for 15 top- and bottom-DR taxa and pathways by distress (middle) and inflammation (bottom) scores, grouped by genus or ontology. Genera or pathways containing more than 1 unique feature are shown as stacked bars. Age, sex, BMI, and race were included as covariates in all models. Parent pathway ontologies were derived from MetaCyc v23.1.

