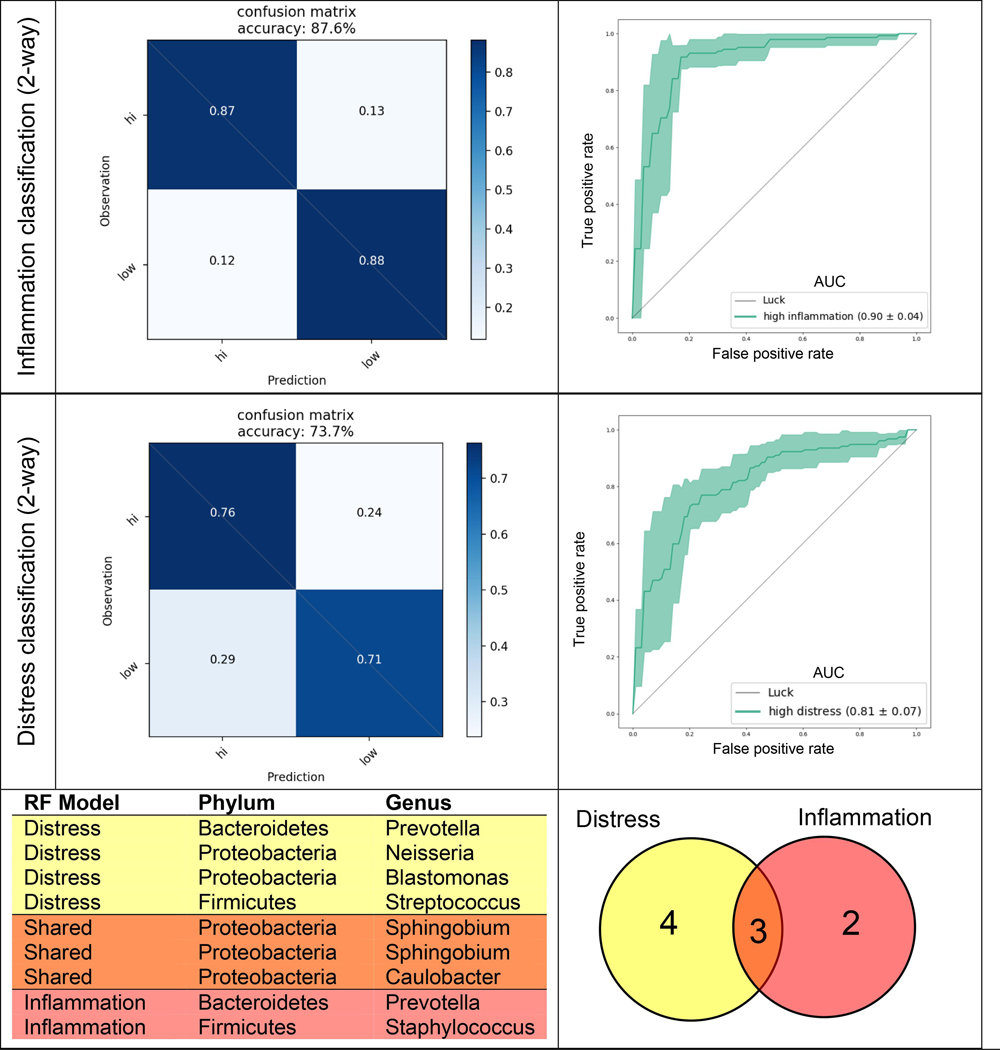
Fig. 3.
Confusion matrices (left) and receiver operating characteristic (ROC) curves (right) derived from 2 random forest (RF) classification models: (top) 2-way inflammation classification (high versus low), (middle) 2-way distress classification (high versus low). Age, sex, BMI, and race were one hot encoded as features in all models. Filtered (> 1% prevalence), normalized (100,000 counts) microbiome counts sampled at all five time points were used, with time point information encoded as an additional feature. All data were CLR transformed prior to training, and grid search sampling employed for each model to optimize parameters. Five-fold stratified cross-validation was performed without test set construction. (Bottom) Table and venn diagram of amplicon sequence variants (ASVs) with feature importance > 0.01 from both RF classifiers. Area under the curve (AUC) values shown in ROC curve legend.

