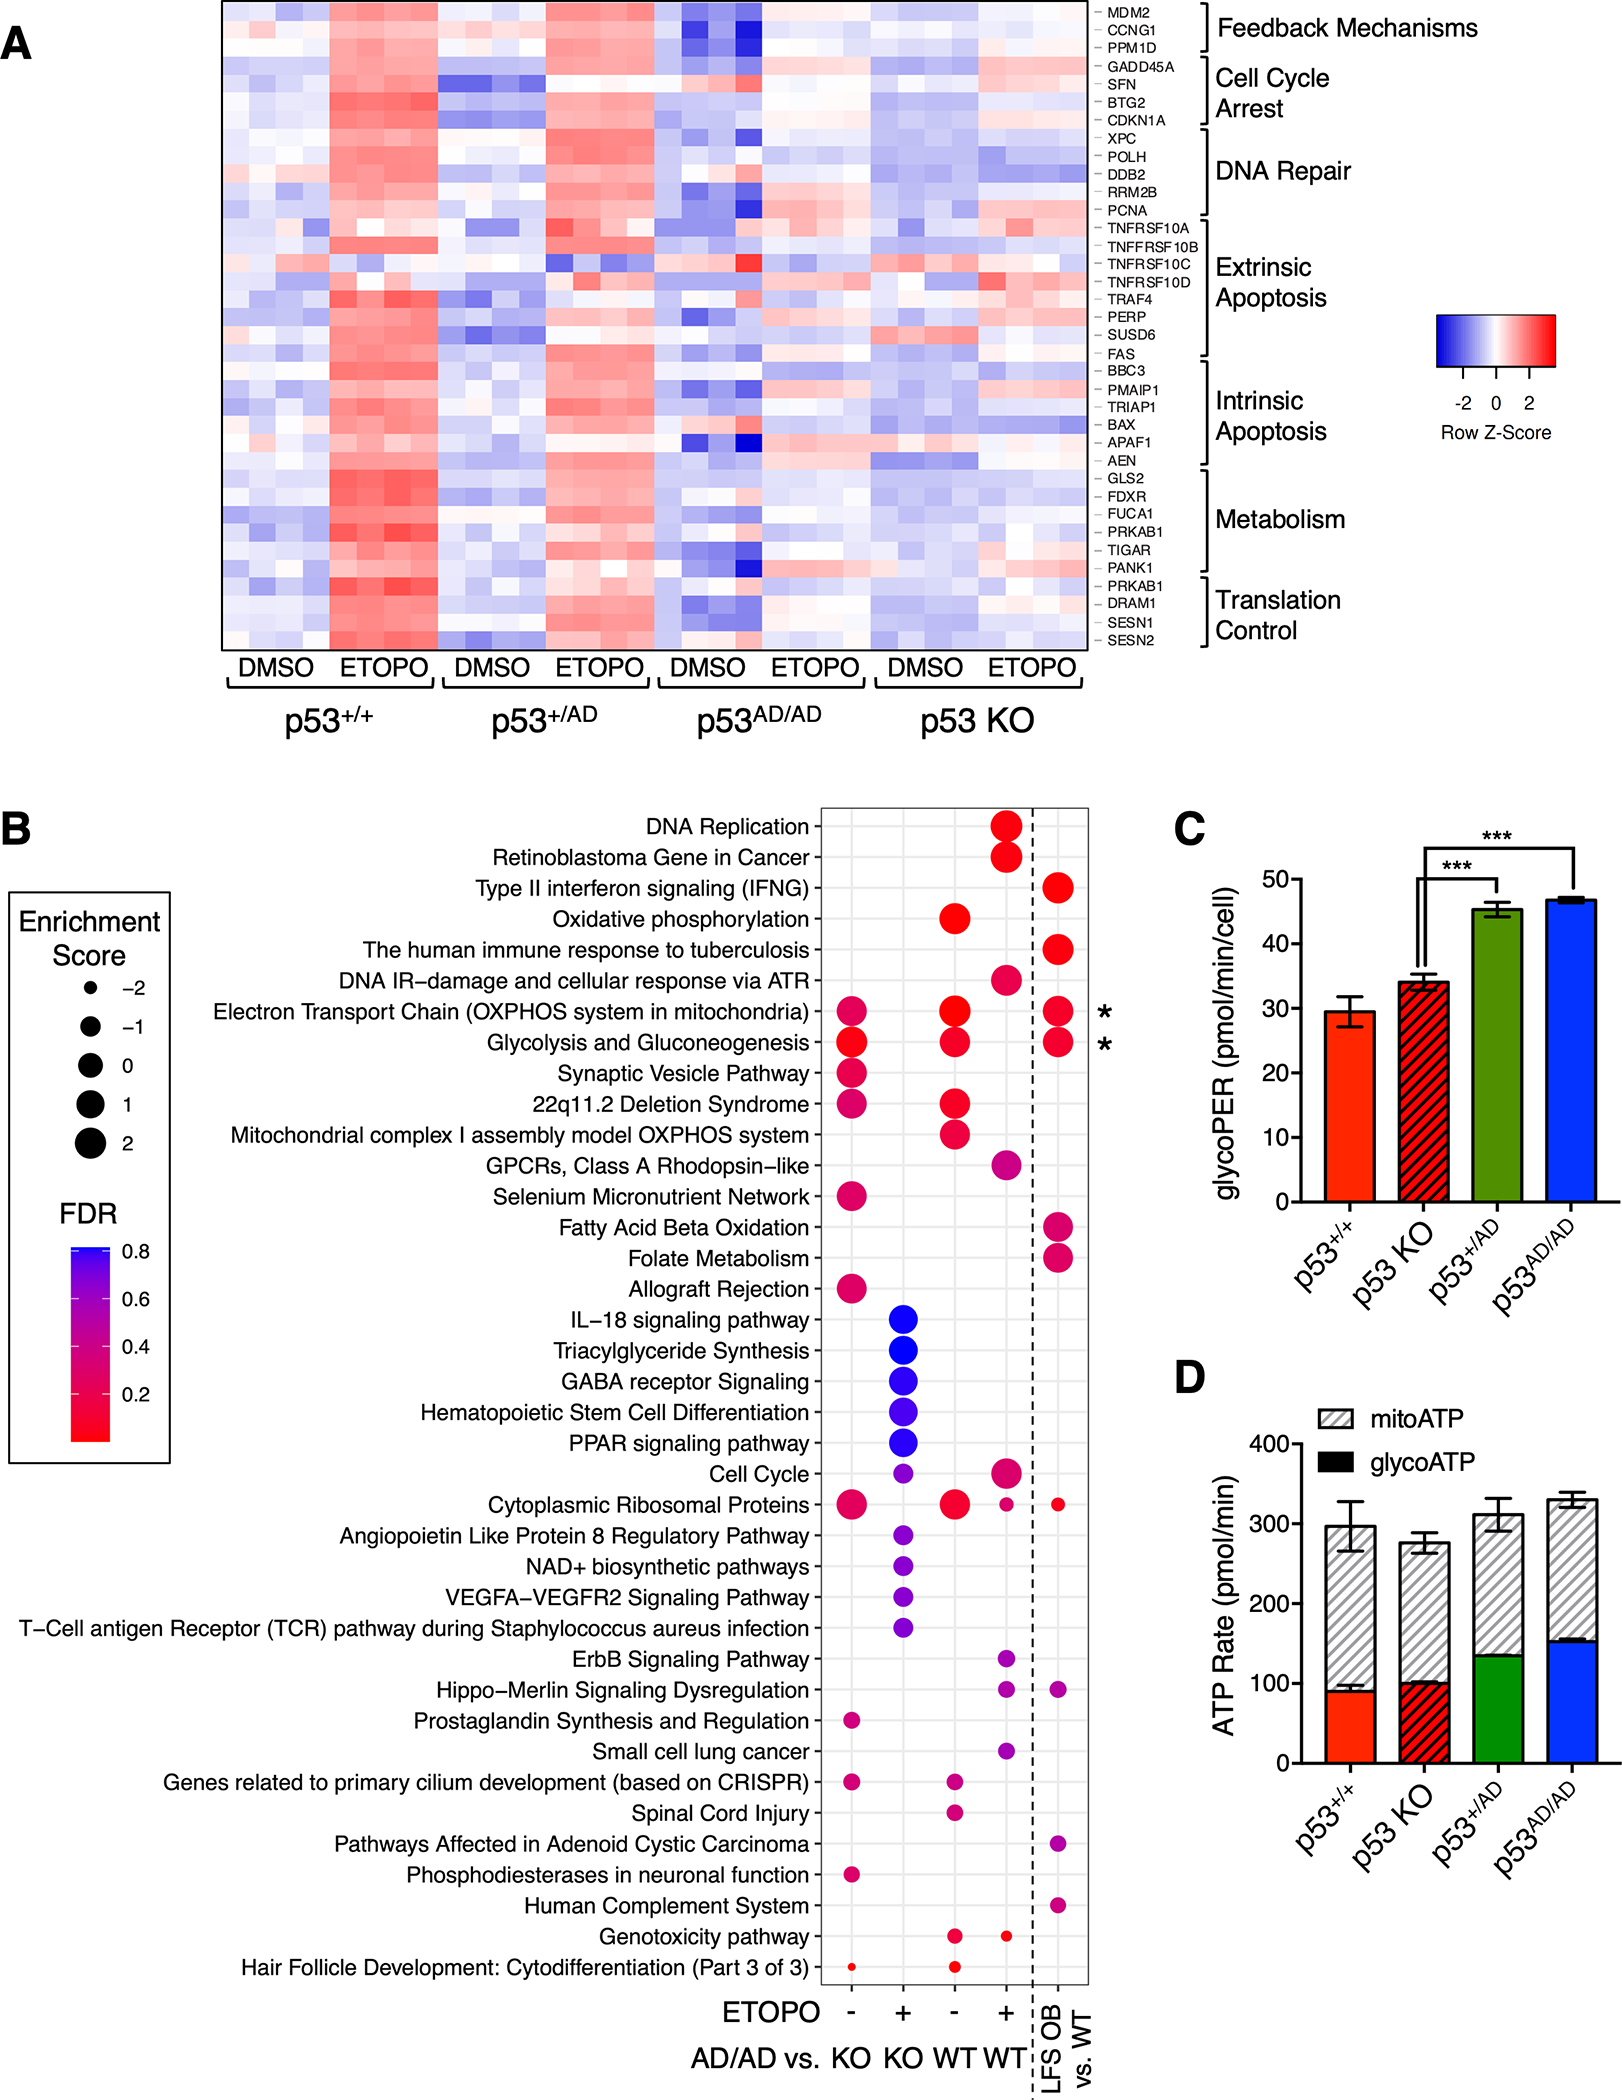
Figure 2. Dimer-forming p53(A347D) is unable to transactivate canonical p53 target genes.

(A). Heatmap depicts differential gene expression of canonical p53 target genes in U2OS p53+/+, p53+/AD, p53AD/AD, or p53 KO cells that were subjected to RNA-sequencing (RNA-seq) following 24 h treatment with either DMSO or 20 μM etoposide (ETOPO). Columns represent individual technical replicates within each condition. Red indicates higher relative expression. Genes at right were assembled into different biological processes.
(B) Dot plot shows pathways positively or negatively enriched in U2OS p53AD/AD cells relative to wild-type p53 and p53 KO cells after DMSO or 20 μM etoposide (ETOPO) treatment and in LFS osteoblasts (OBs) relative to wild-type OBs. Relative dot size represents enrichment score, and color indicates false discovery rate according to legend.
(C) Basal glycolytic rate in p53+/+, p53 KO, p53+/AD, p53AD/AD U2OS cells seeded at equivalent densities was measured by the Seahorse XFp Analyzer. Glycolytic proton efflux rate (pmol/min) serves as a measure of glycolytic rate and was assessed in real-time. Data represent the mean ± SEM of three biologically independent experiments. (n=3).
(D) Glycolytic and mitochondrial ATP production rates (pmol/min) in p53+/+, p53 KO, p53+/AD, p53AD/AD U2OS cells were measured using the Seahorse XF Real-Time ATP Rate Assay kit. Data represent the mean ± SEM of two biologically independent experiments. (n=2).
