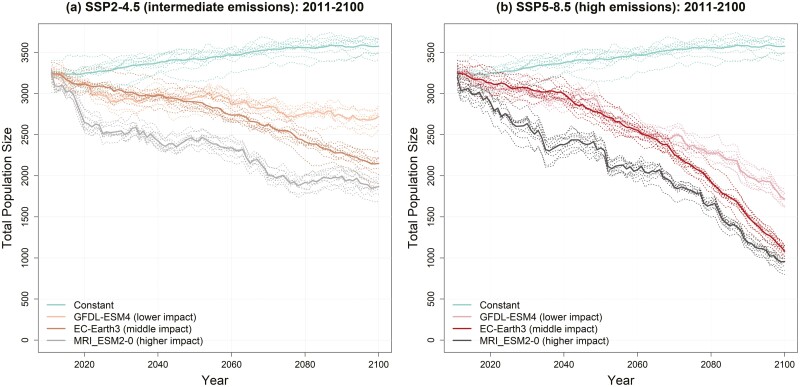
Fig. 3.
Population trajectories for southwestern willow flycatchers under constant selection (1981 to 2010 average maximum breeding season temperature) and variable selection due to climate change under (a) an intermediate emissions scenario (SSP2-4.5), and (b) a high emissions scenario (SSP5-8.5). Each scenario shows responses to 3 generalized circulation models (GCMs) that bracket GCM projections across western North America. Solid lines are the mean of 10 MC replicates (dotted lines).

