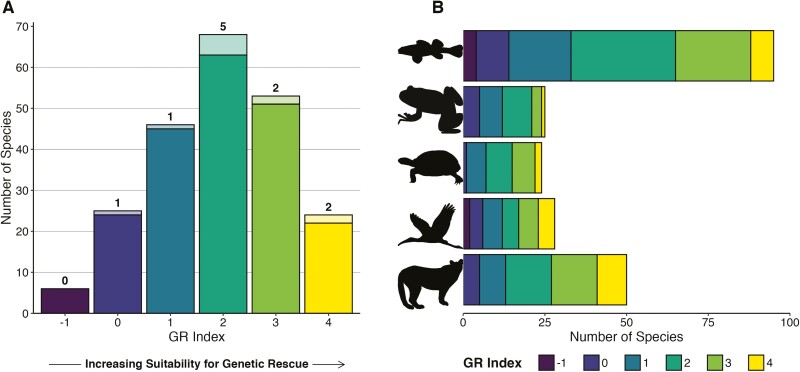
Fig. 1.
Distribution of GR index across endangered and threatened vertebrates listed by the U.S. Fish & Wildlife Service. A) GR index across all vertebrates surveyed. Numbers and lighter shading represent species that had explicit mention of genetic rescue in recovery documents. B) GR index across taxonomic groups. Silhouettes were downloaded from PhyloPic; desert tortoise silhouette ©Andrew A. Farke (https://creativecommons.org/licenses/by/3.0/legalcode).

